Drill-down report tables
Open the full drill-down table for any dimension, switch dimensions, filter by clicking a row and export up to 1,000 rows as CSV or JSON, also through the API.
View all on any Overview panel (or Pages and Sources in the sidebar) opens the full table for that dimension.
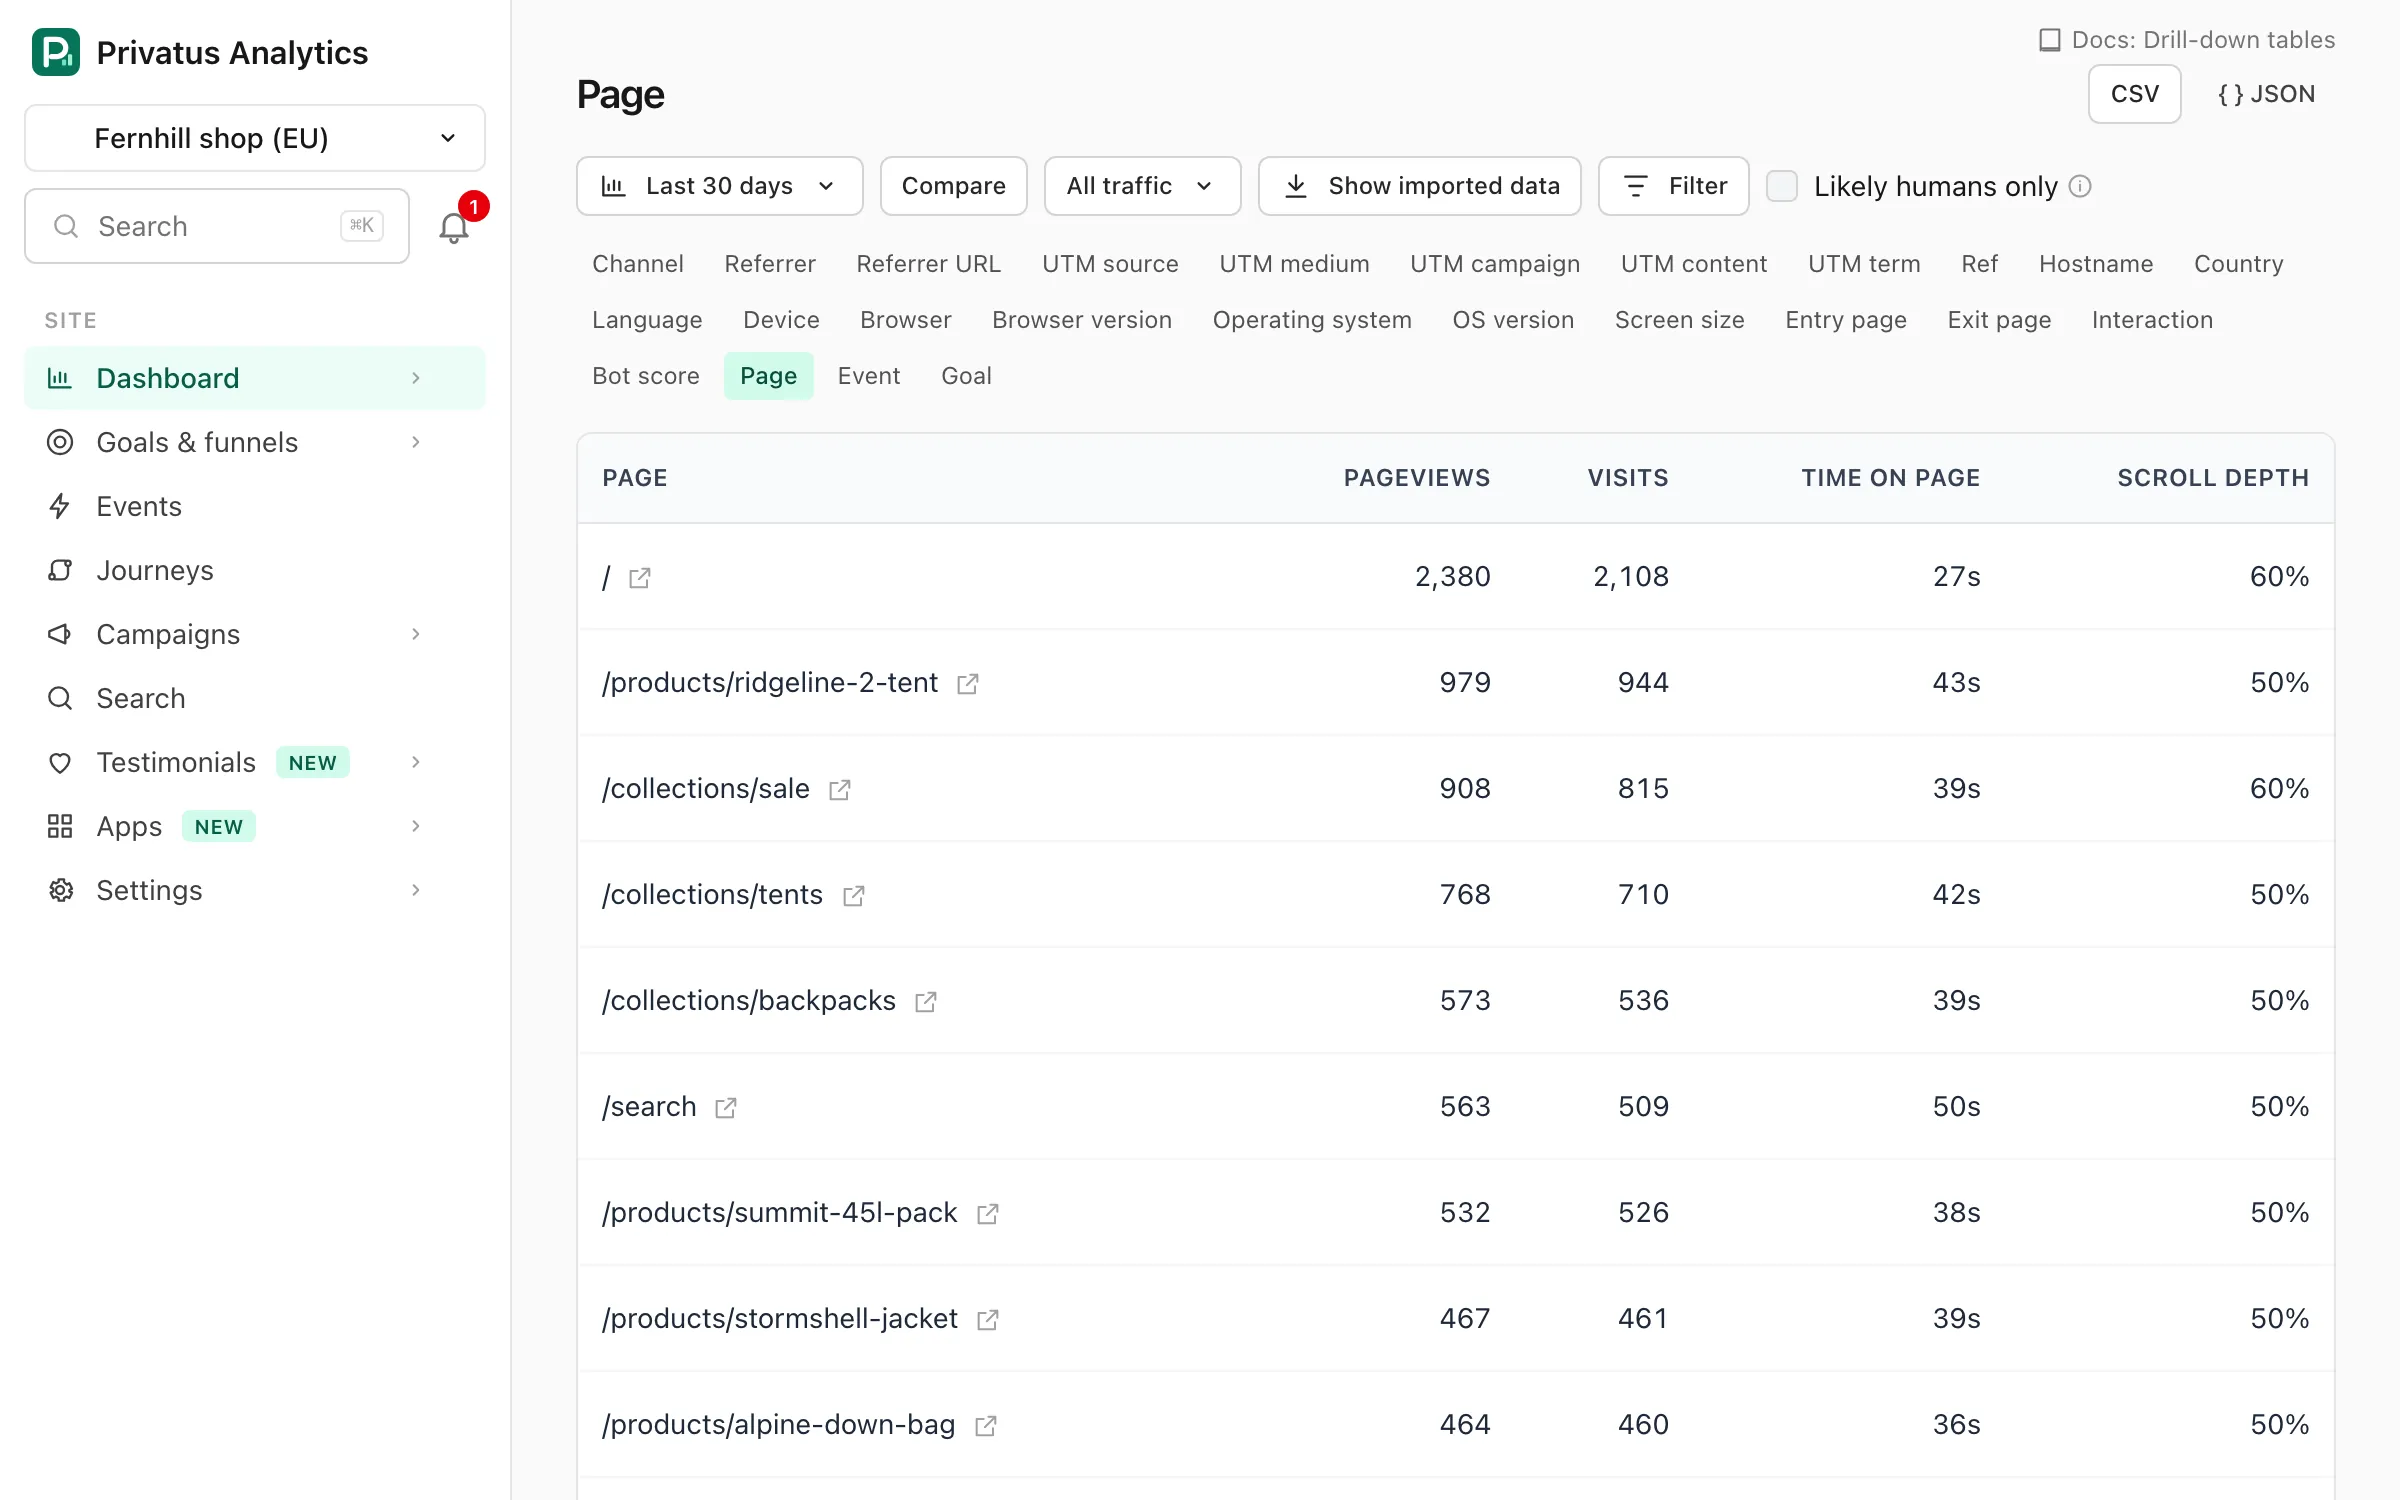
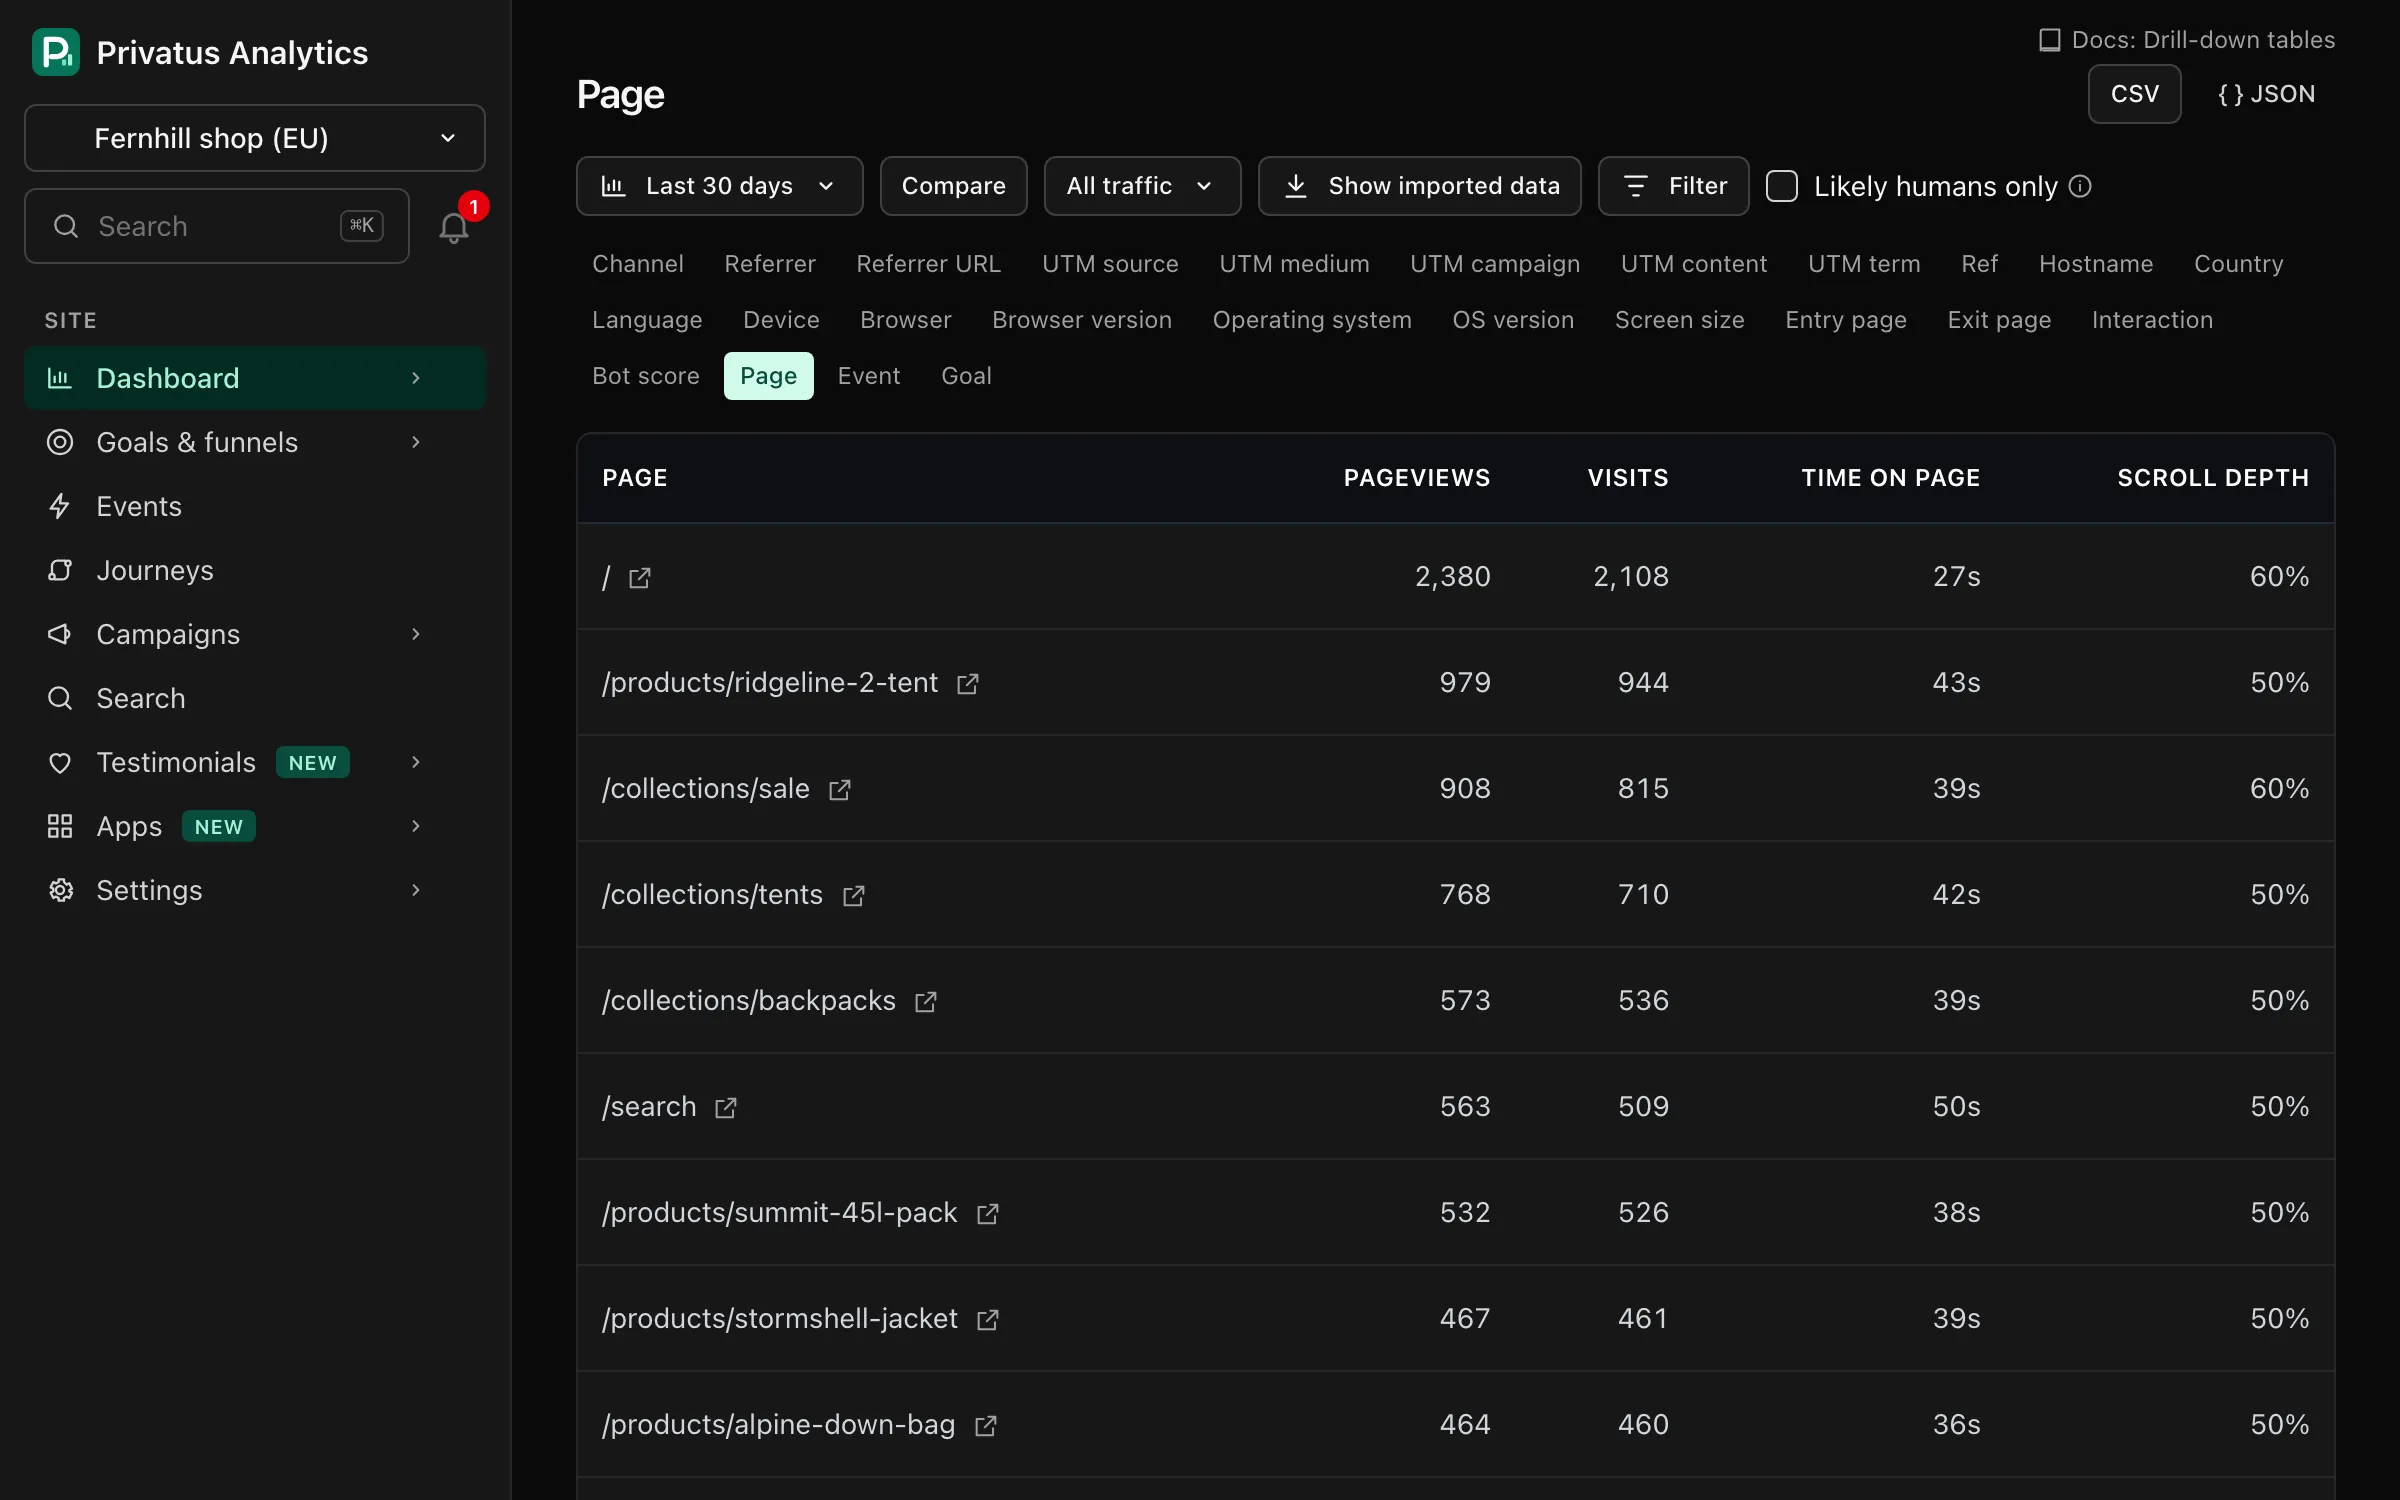
| Control | What it does |
|---|---|
| Toolbar | The same date range, comparison, segment and filter controls as the Overview. The table follows them |
| Dimension list | Switches the table to another dimension. It lists every dimension except custom properties |
| A row | Opens the Overview filtered by that value |
| The icon next to a page | Opens the page detail view |
| The icon next to a referrer | Opens that site's referrer detail |
| Previous and Next | Move through the table, 10 rows at a time |
| CSV | Downloads the first 1,000 rows |
| JSON | The same table from the API |
Columns#
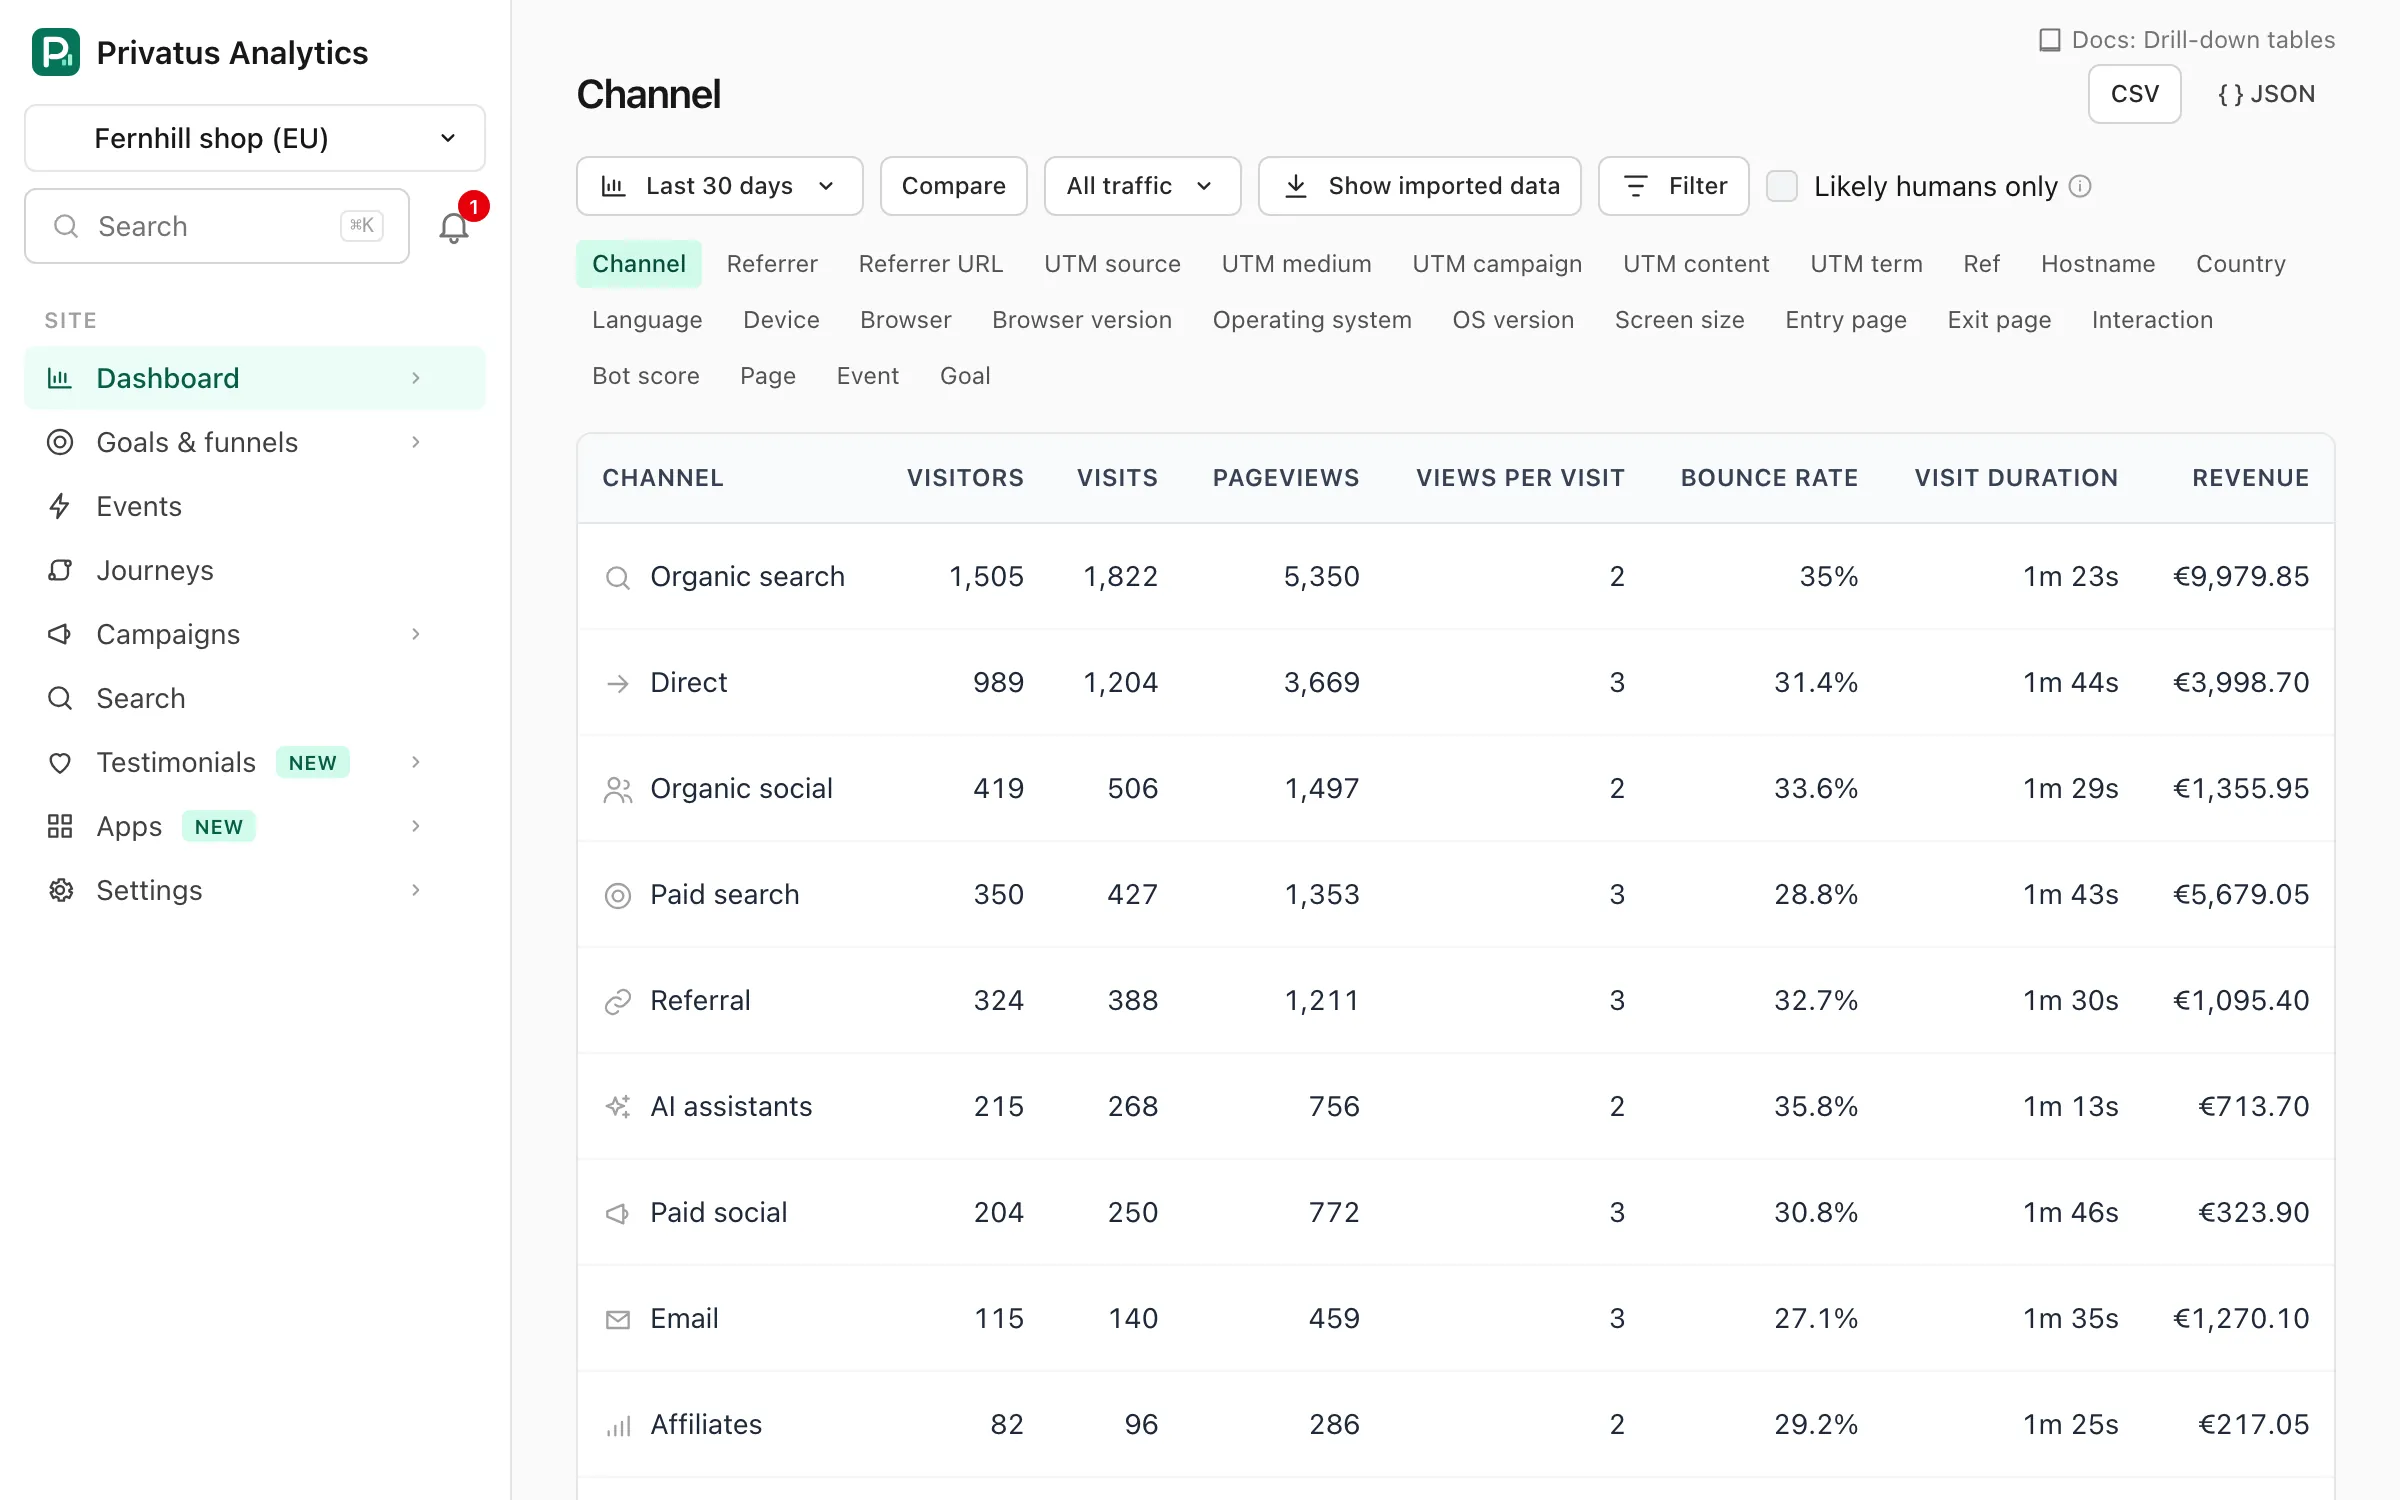
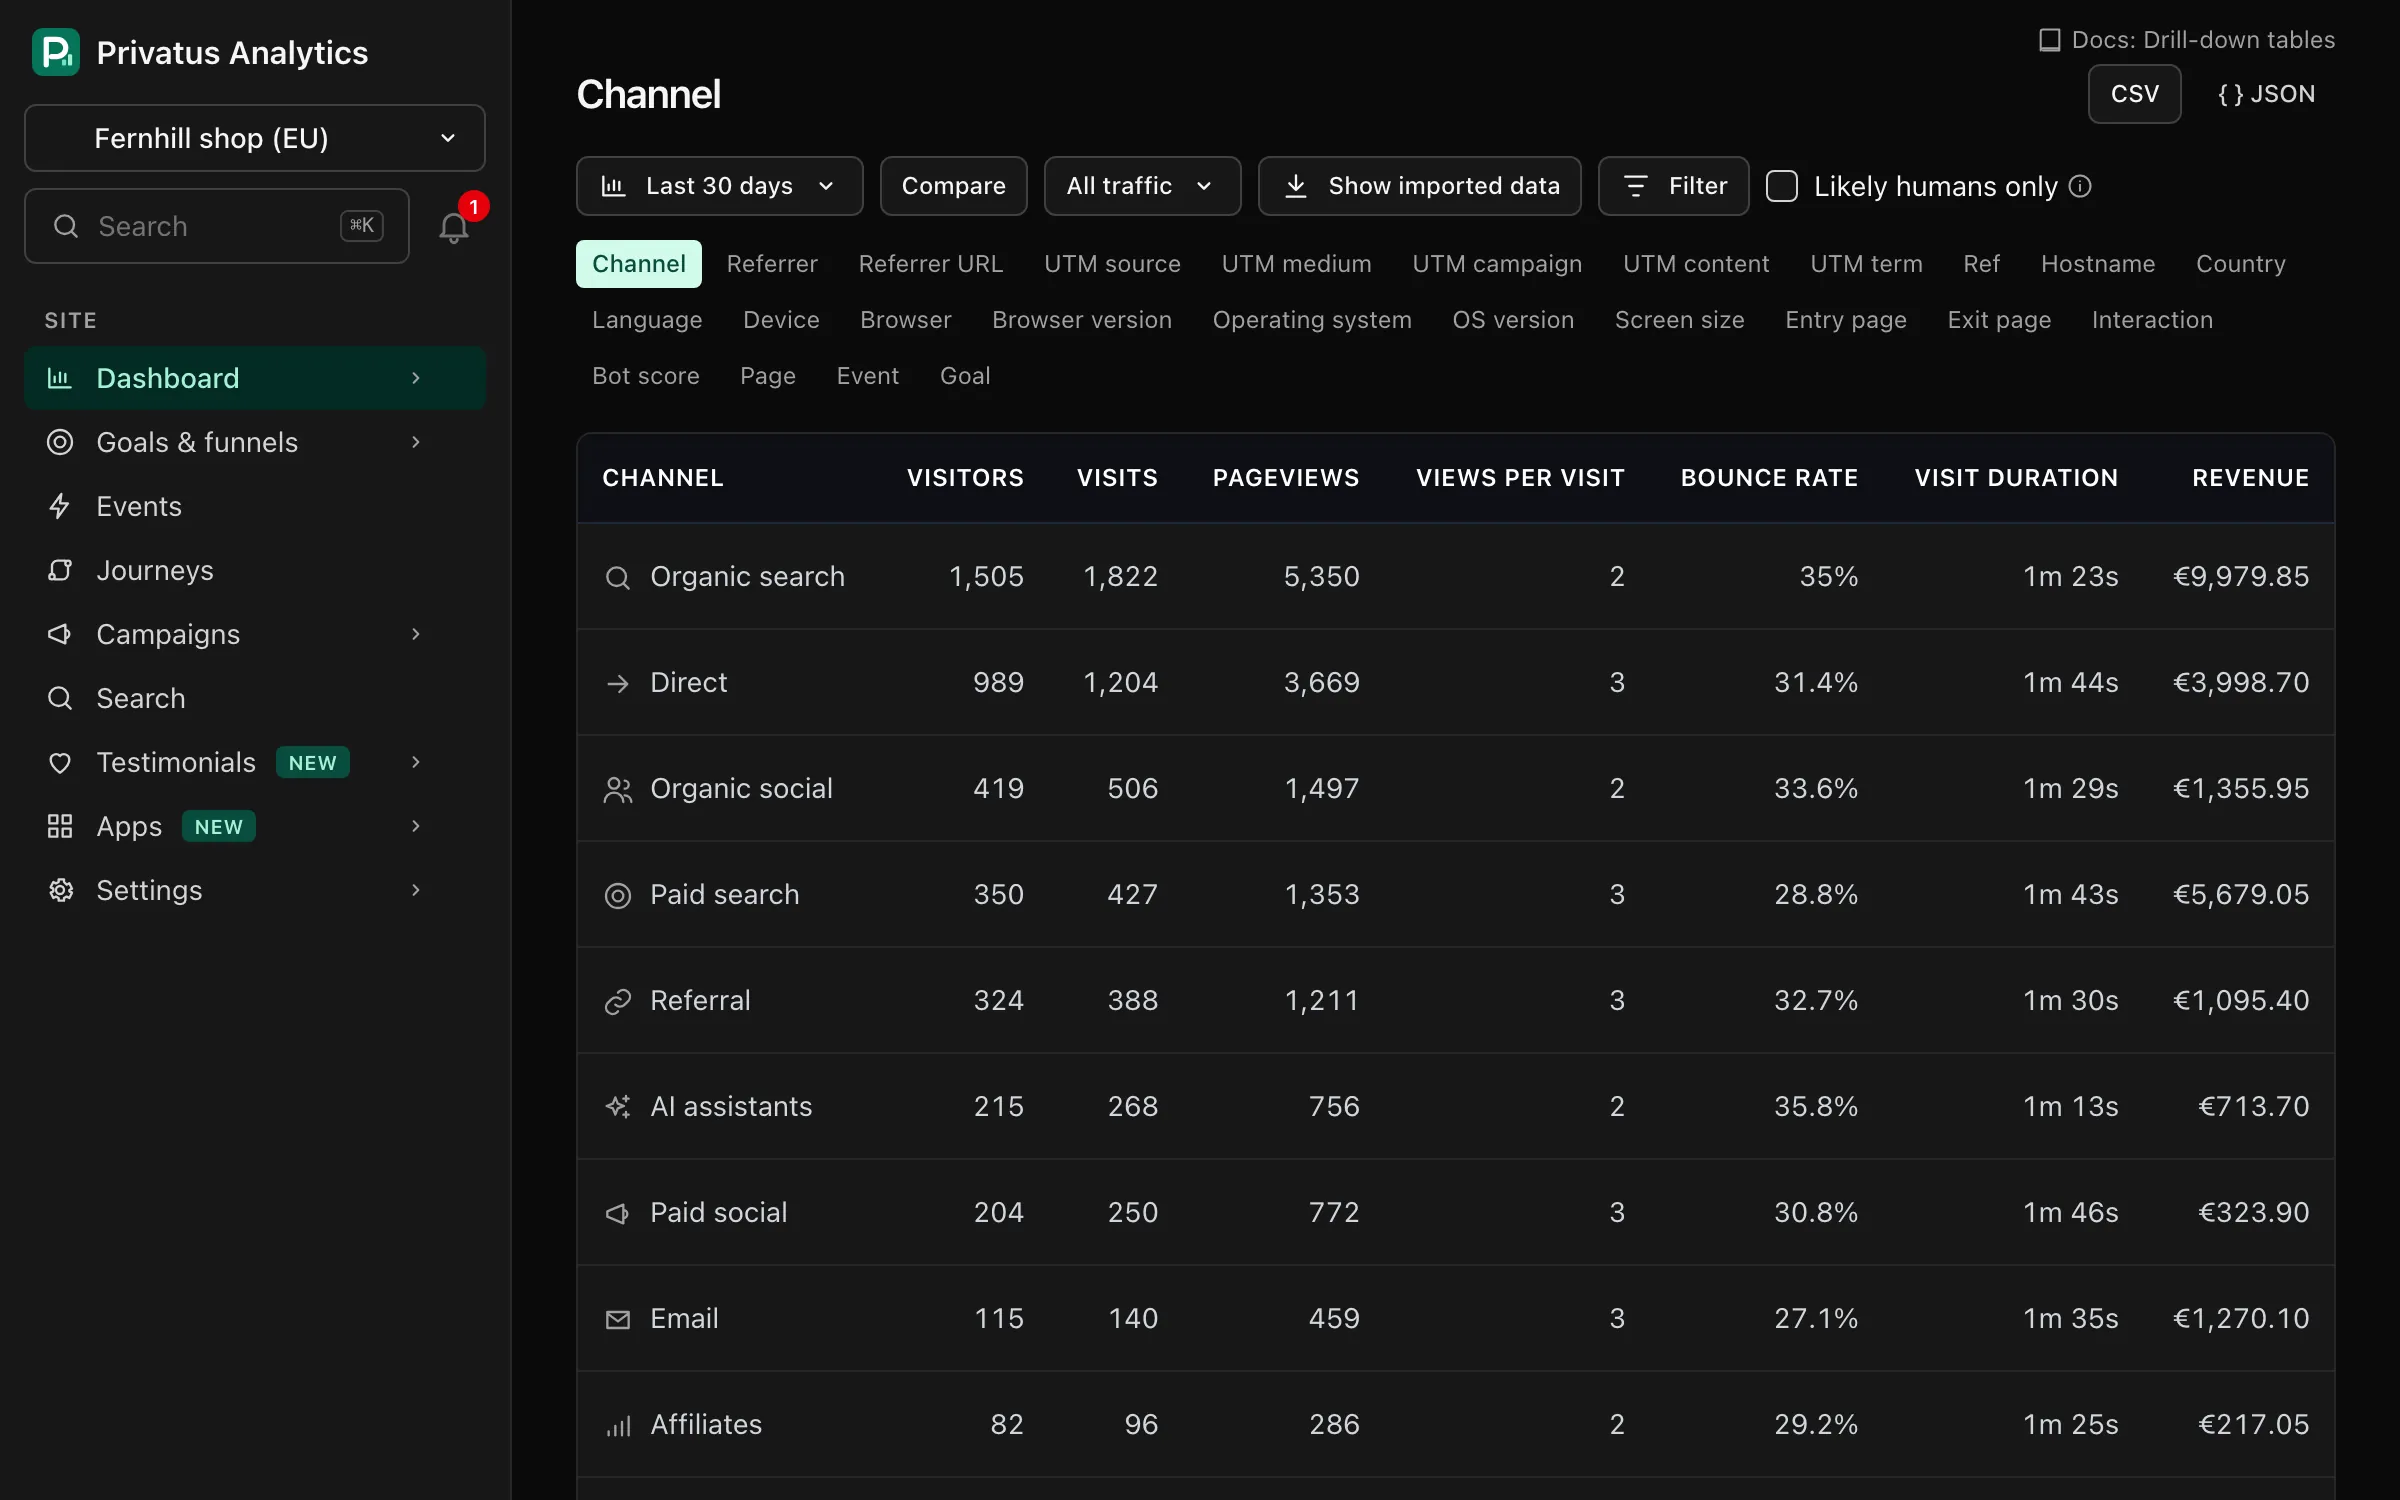
| Dimension | Columns |
|---|---|
| Page | Pageviews, visits, median time on page, median scroll depth |
| Event, custom property | Completions, visits, revenue, conversion rate |
| Goal | Completions, conversions (visits that converted), conversion rate, goal value |
| Every other dimension | Visitors, visits, pageviews, views per visit, bounce rate, visit duration, revenue |
Every metric is defined in Metrics & definitions.
Rows are ordered by the first column, largest first.
API#
Each table is the breakdown operation (MCP: stats_breakdown):
sh
curl "https://privatusanalytics.com/sites/pa_7Q2K9XH3AB/breakdown/page.json?period=30d&limit=100&page=2" \
  -H "Authorization: Bearer $PRIVATUS_TOKEN"
| Parameter | What it does |
|---|---|
limit |
Rows per page, 1 to 1,000 (default 10) |
page |
Page number (default 1) |
sort |
visitors, visits, pageviews or revenue. Without it, rows are ordered by the dimension's main metric |
The date range, comparison, filter and segment parameters are the same as
for every stats operation. Add .csv instead of .json to download the
rows as CSV. A custom property is the dimension prop:<key>. See
Stats endpoints.