Custom dashboards across your sites
Build custom dashboards from metric, chart, breakdown, goal, funnel, live, uptime, Web Vitals and subscription cards, mixing sites in a workspace.
A custom dashboard is a named page of cards. Each card is a small report for one site, and one dashboard can mix cards from any sites you can access in the workspace, for example one dashboard per team or client.
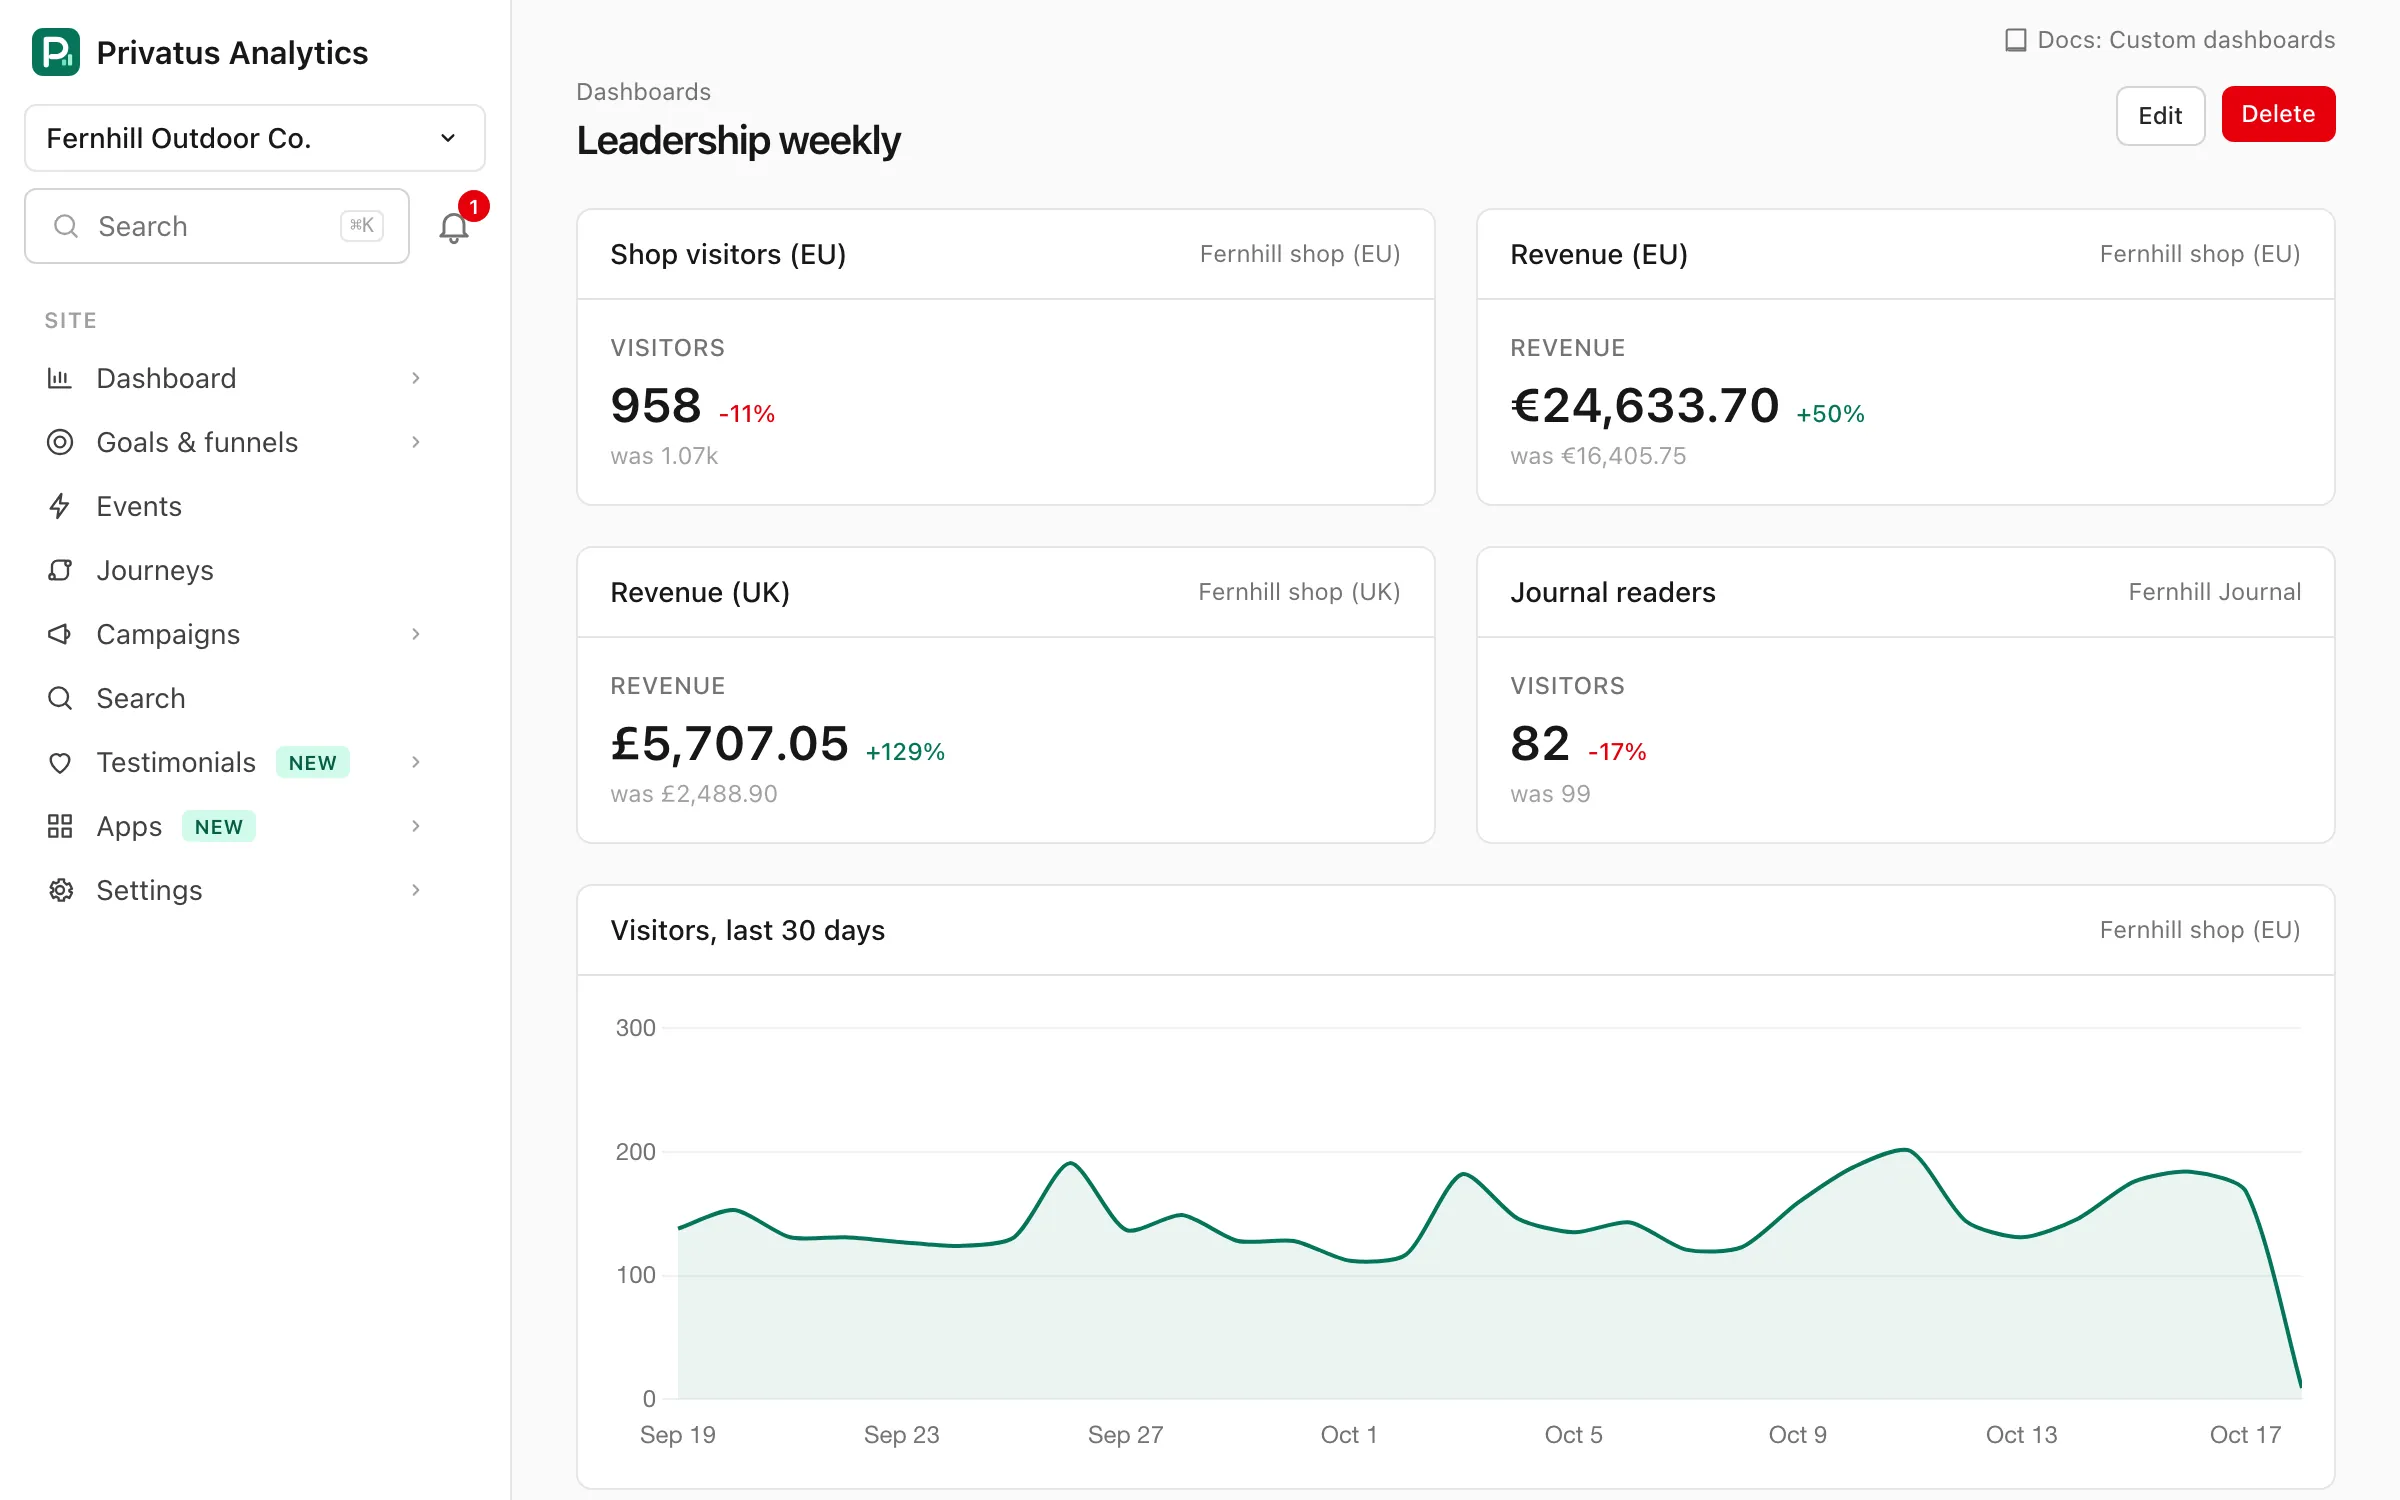
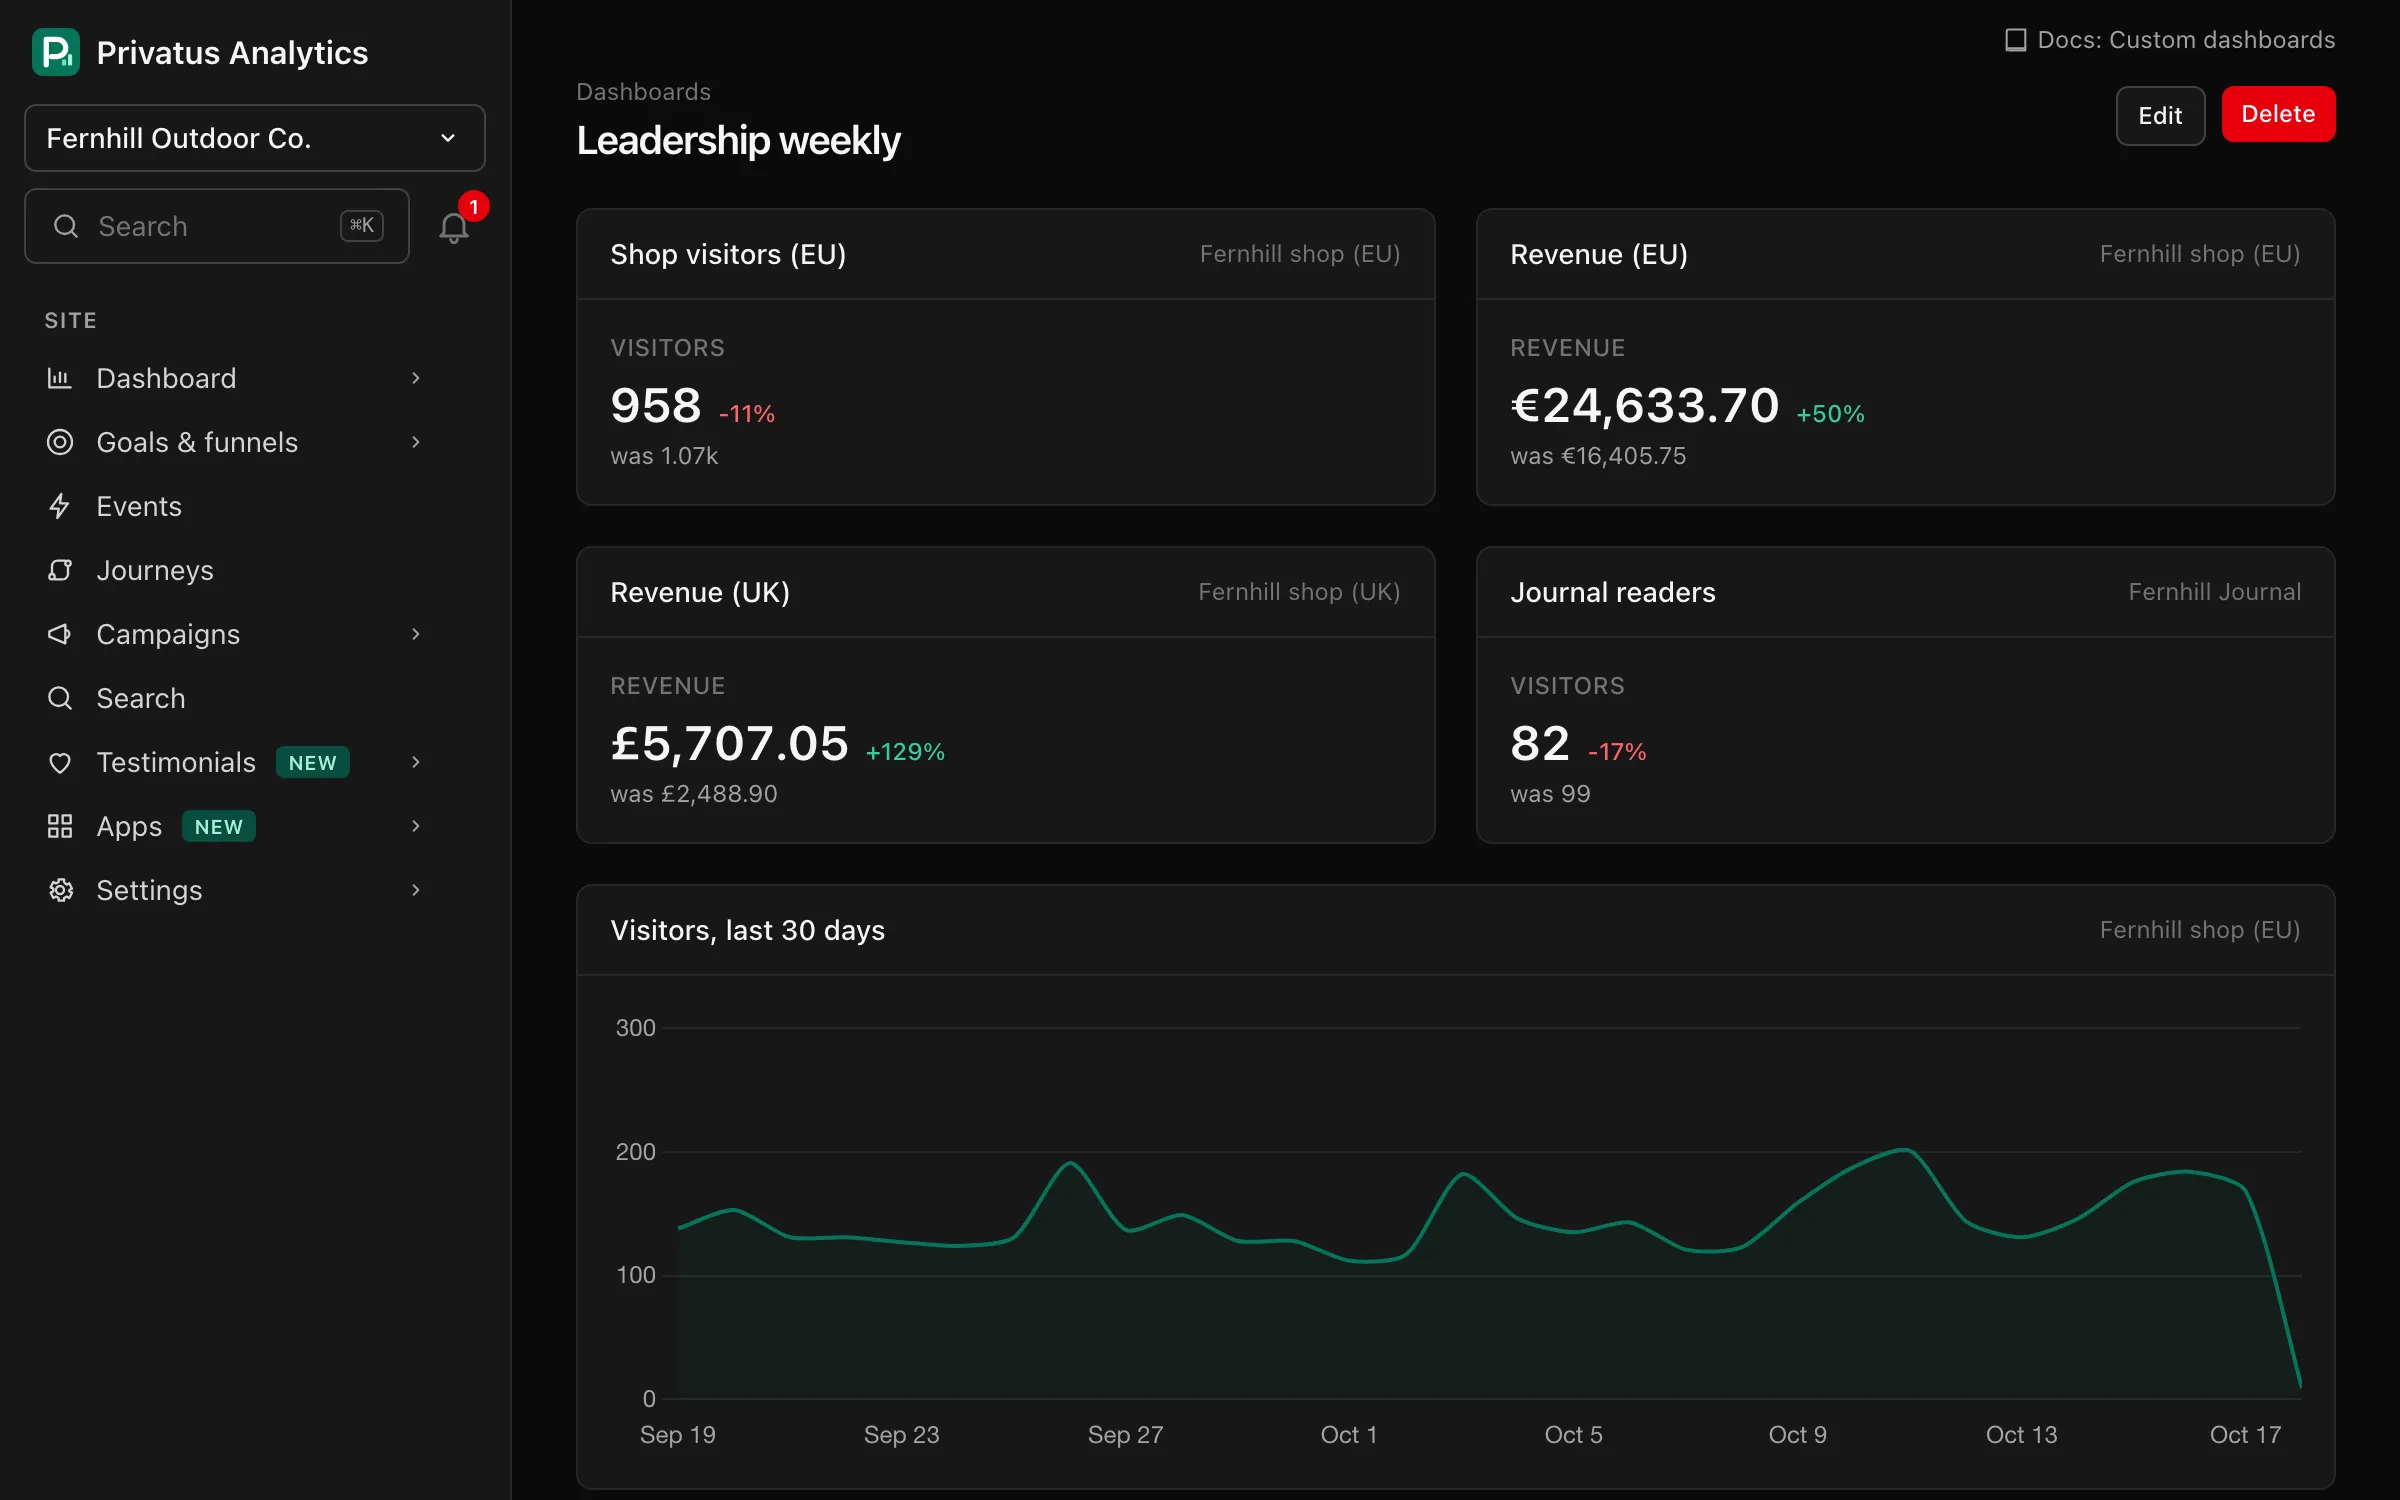
A workspace has 1 custom dashboard on the Free plan, 3 on Pro and as many as it needs on Business and Enterprise. Nothing is deleted when a workspace moves to a smaller plan: the oldest dashboards stay open, up to the plan's count, and the rest are marked "Not on your plan" in the list. A locked dashboard can be deleted, which opens the next one, and it opens again when you upgrade.
Open Dashboards in the Workspace section of the sidebar. The list is sorted by name and shows how many cards each dashboard has. Dashboards belong to the workspace, so every member who can read analytics sees the same list.
Creating and editing#
Click New dashboard (or press N on the list). On a dashboard, click
Edit (or press E) to change it, or Delete to remove it after a
confirmation.
- Give the dashboard a name (required, up to 100 characters).
- Click Add card and choose the card's type and site. The title is optional (up to 80 characters). Without one, the card is headed with its type.
- Set the options for that type. The form shows only the options the chosen type uses.
- Use the arrow buttons to move a card up or down, and the remove button to drop it. Cards appear on the dashboard in the order of the list.
- Click Save dashboard.
A dashboard holds up to 40 cards. At 40, Add card is turned off. A dashboard can be saved without cards, except by a member who is limited to some sites.
| Field | What it does |
|---|---|
| Name | The dashboard's name in the list and as the page title |
| Type | What the card shows. See Card types |
| Site | The site the card reports on, from the sites you can access |
| Title (optional) | The card's heading. Empty uses the type's name |
| Period | The date range of the card. Not shown for Live visitors and Uptime |
| Metric | The number a Metric or Chart card shows |
| Breakdown | The dimension a Breakdown card lists |
| Funnel id (optional) | Which funnel a Funnel card shows |
Tip: N and E are part of the
keyboard shortcuts, which you can
turn off in your account settings.
Card types#
| Type | What it shows | Options |
|---|---|---|
| Metric | One metric for the period, the change against the previous period and the previous value | Period, metric |
| Chart | One metric over time. On wide screens it takes two columns | Period, metric |
| Breakdown | The top 5 values of one dimension, with visitors (pageviews for pages, completions for events) | Period, breakdown |
| Goals | Up to 5 of the site's goals, most completions first, with their conversions | Period |
| Live visitors | Visitors in the last 5 minutes | None |
| Funnel | A funnel's name and overall conversion rate, and for each step its count and the conversion rate from the first step | Period, funnel id (optional) |
| Uptime | Up to 5 of the site's uptime checks, with their status and uptime over the last 7 days | None |
| Web Vitals | The 75th percentile and rating of LCP, INP, CLS, FCP and TTFB. See Performance | Period |
| Subscriptions | MRR with its change over the last 30 days, active subscriptions and churn. Nothing to show until the site has a payment provider connected. See Subscription metrics | None |
The breakdown option offers Page, Channel, Referrer, UTM source, UTM campaign, Country, Device, Browser, Operating system, Entry page and Event. It starts on Page.
The funnel id is the funnel's id, which starts with fun_. Leave it
empty and the card shows the site's oldest funnel.
Periods and metrics#
Each card has its own period, counted in its site's timezone. The choices are the date range presets: Today, Yesterday, Last 24 hours, Last 7, 14, 28, 30 or 90 days, Month to date, Last month, Quarter to date, Last quarter, Year to date, Last 12 months, Last calendar year and All time. The default is Last 7 days. Custom date ranges, filters and segments are not part of a card.
Metric and Chart cards show one metric: Visitors (the default), Visits, Pageviews, Views / visit, Bounce rate, Visit duration or Revenue (in the site's currency).
The numbers come from the same reports as the site's own pages, so a card and the site's Overview agree for the same period. See Metrics for how each one is counted.
Permissions#
| Action | Permission | Built-in roles |
|---|---|---|
| View the list, a dashboard and its cards | analytics.read |
Owner, Admin, Editor, Analyst, Viewer |
| Create, edit and delete dashboards | content.write |
Owner, Admin, Editor, Analyst |
See Roles and permissions for the full matrix.
Site access applies card by card:
- The site list in the form holds only the sites you can access. Saving a new card for any other site is refused.
- A card for a site you can't access shows "You don't have access to this
card's site." in place of its data, and its title and settings are not
shown to you. The rest of the dashboard works as usual. Over the API such
a card is
{"type": "...", "status": "no_access"}. - When you edit a dashboard, cards that a member with wider access added are kept, even for sites you can't see. The form shows each one as a locked row that you can move but not change. Over the API, send the card back as you got it. You can't change it, add a card for that site, or remove that site's last card.
- A dashboard with no card for a site you can access is not in your list.
- Deleting a dashboard needs access to the sites of all its cards.
How cards load#
The dashboard opens at once and each card then loads by itself as it comes into view, so a slow card never holds up the others. Until its data arrives, a card shows its title and "Loading…".
- The site name in a card's header opens that site's overview for the card's period.
- A card with nothing to report says "Nothing to show for this card yet.", for example a Funnel card on a site without funnels or an Uptime card on a site without checks.
- Cards load once per page view. Reload the page for fresh numbers.
Cards sit in one column on phones, two on tablets and three on wide screens.
API#
Dashboards are a REST resource under
/workspaces/<workspace id>/dashboards and MCP tools named dashboards_*
(dashboards_list, dashboards_get, dashboards_create,
dashboards_update, dashboards_delete). Dashboard ids start with
dash_. The API reference lists every input.
A card is an object with a type, a site_id, an optional title and
params:
{
  "name": "Client: Acme",
  "cards": [
    { "type": "metric", "site_id": "pa_7Q2K9XH3AB",
      "params": { "period": "7d", "metric": "pageviews" } },
    { "type": "breakdown", "site_id": "pa_7Q2K9XH3AB", "title": "Countries",
      "params": { "dimension": "country", "limit": 10 } }
  ]
}
type |
params |
|---|---|
metric |
period, metric |
chart |
period, metric, interval |
breakdown |
period, dimension, limit |
goal |
period, limit |
funnel |
period, funnel_id |
live |
None |
uptime |
limit |
vitals |
period |
subscriptions |
None |
An Uptime card lists the site's checks plus the workspace checks that watch its domain or a subdomain (see uptime).
periodis a preset code:today,yesterday,24h,7d(the default),14d,28d,30d,90d,mtd,last_month,qtd,last_quarter,ytd,12mo,last_yearorall.metricisvisitors(the default),visits,pageviews,views_per_visit,bounce_rate,visit_durationorrevenue.funnel_idis a funnel'sfun_…id. Without it, or with an id that is not one of the site's funnels, the card shows the site's oldest funnel.titleis cut to 80 characters.limitis the number of rows, from 1 to 10 (default 5).dimensiontakes any dimension, includingprop:<key>.intervaltakes the chart intervals (defaultauto).- Params a type does not use are dropped. A card with an unknown type, period, metric or dimension is refused, and the error names the card's position.
- Sending
cardsin an update replaces the whole list.
GET /workspaces/<workspace id>/dashboards/<dashboard id>/cards/<index>
(MCP: dashboards_card) returns the data for one card, counting from 0.
Its status is ok, no_access or not_available.