Analytics dashboard overview
The main site dashboard explained: headline metrics like visitors and bounce rate, the main chart, comparisons, filters and breakdown panels by source and page.
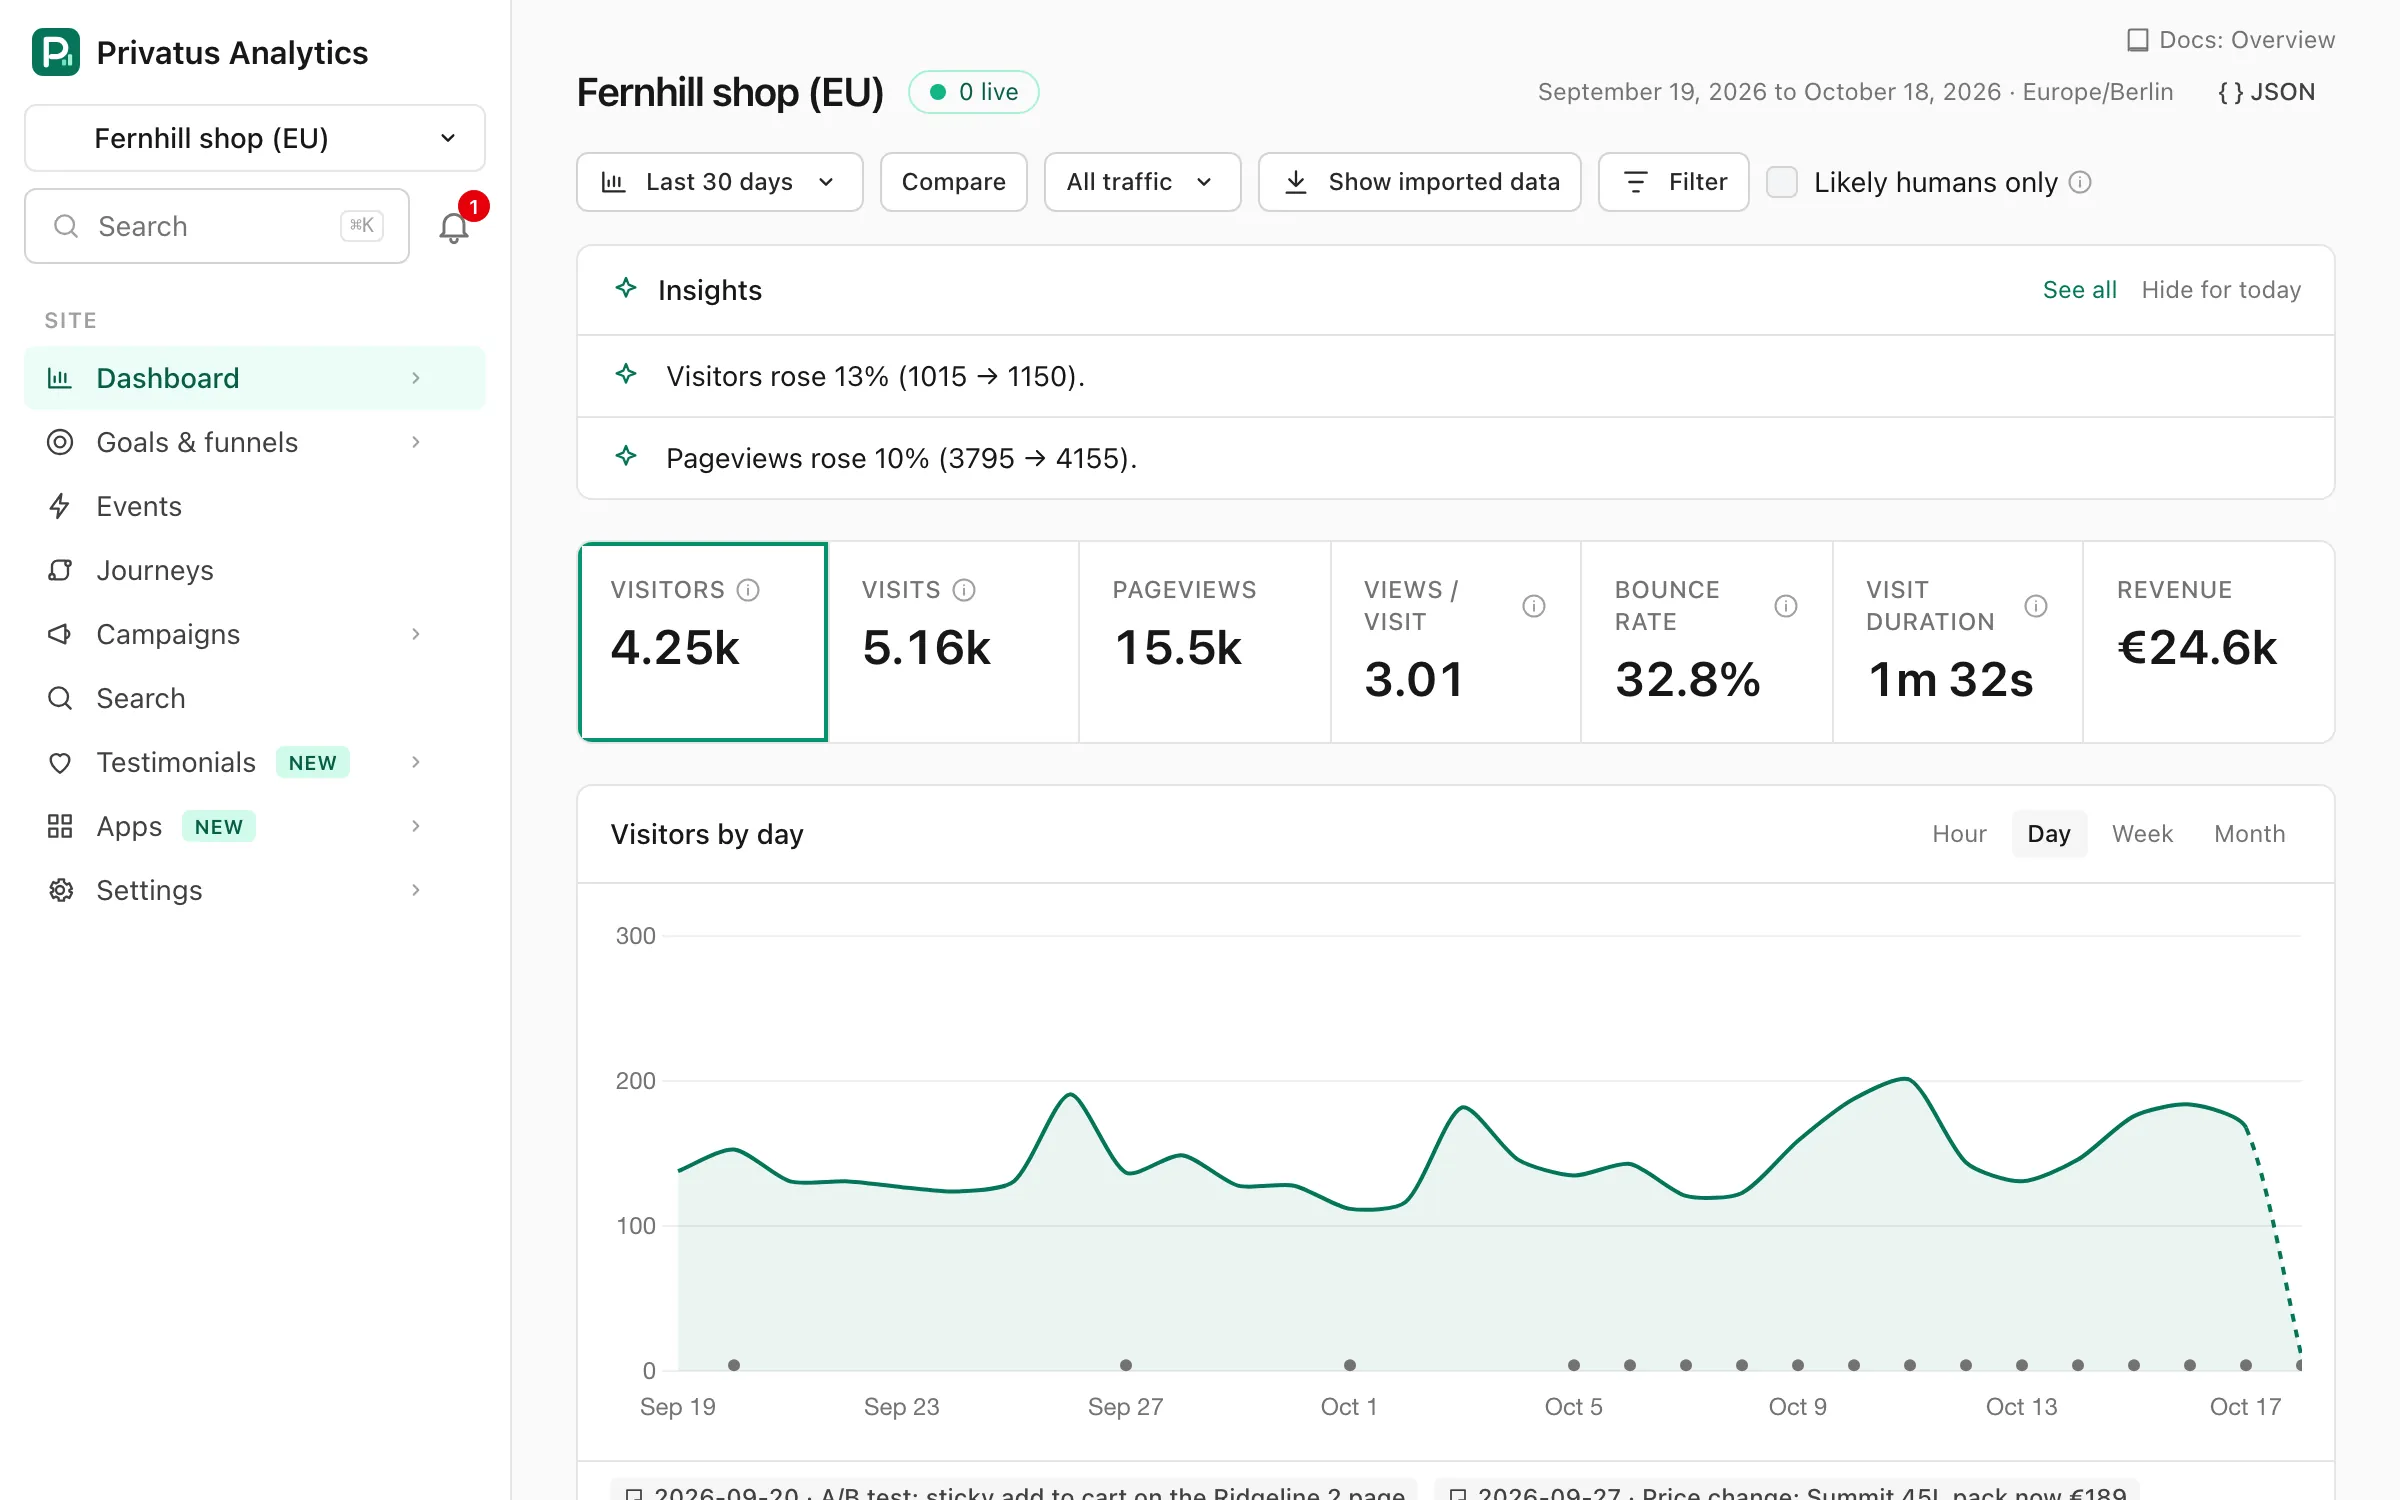
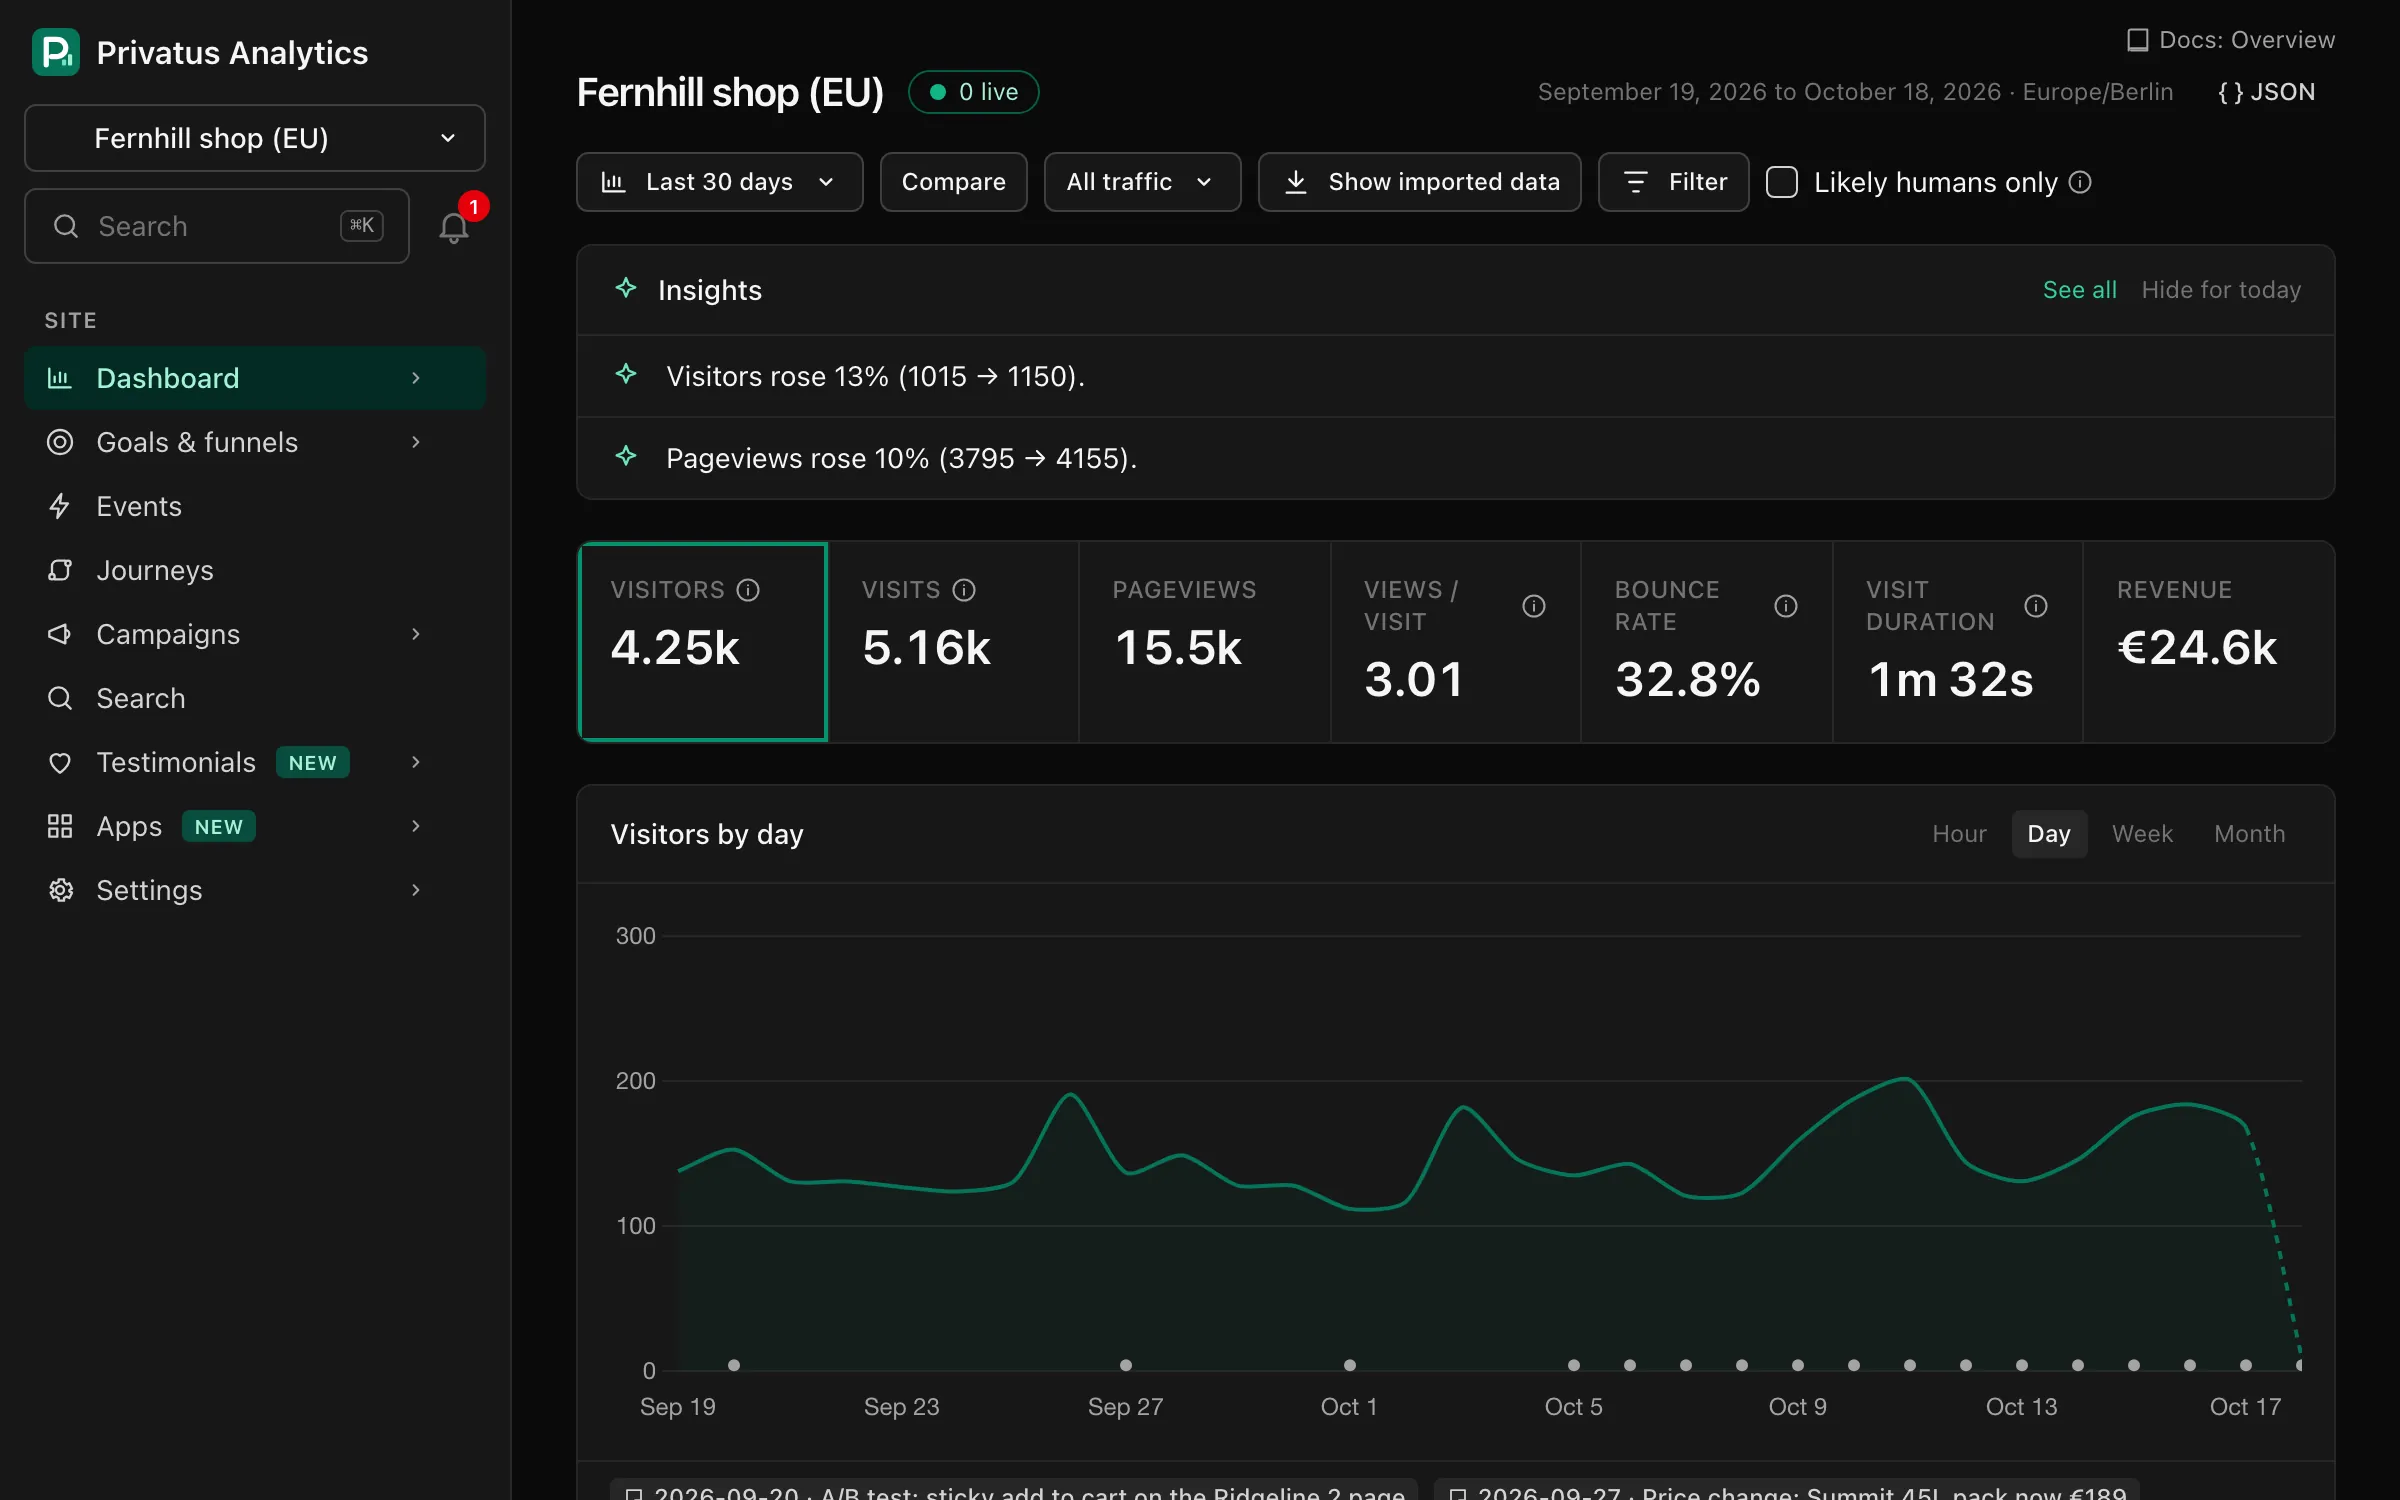
The Overview is a site's main page: headline metrics, one chart and six panels, all for the date range, filters and segment in the toolbar. The header shows the range, the site's timezone, a Live pill with the current visitor count (it opens Live) and JSON, the same view from the API.
Toolbar#
| Control | What it does |
|---|---|
| Date menu | Presets and a custom range. See Date ranges |
| Compare | Compares with the previous period. Click again to turn it off |
| vs last year | Shown while comparing. Compares with the same period last year instead |
| Segment menu | Applies a saved segment. Shown once the site has one |
| Show imported data | Shown when the site has a finished import. Adds imported history for dates before your first tracked event. It is not applied while filters or a segment are active |
| Filter | Opens the filter builder |
| Save as segment | Shown while filters are active. Saves them as a segment |
Custom comparison ranges are available through the URL and API
(compare=custom with compare_from and compare_to).
Headline metrics#
| Card | What it shows |
|---|---|
| Visitors | Unique visitors, counted per day |
| Visits | Visits (sessions) |
| Pageviews | Pages viewed |
| Views / visit | Pageviews divided by visits |
| Bounce rate | The share of visits with at most one pageview, no custom event and under 10 seconds of engaged time |
| Visit duration | The median engaged time of a visit |
| Revenue | Revenue in the site currency. Shown only when the range has revenue |
Every metric is defined in Metrics & definitions.
While comparing, each card also shows the change in percent and the previous value ("was …"). Click a card to plot that metric on the main chart.
Main chart#
- Interval: Hour, Day, Week or Month. Hour needs a range of 14 days or less. The API also accepts minute, quarter, year and auto (see Intervals).
- The comparison period is drawn as a thin dashed line.
- The current, incomplete period is drawn dashed.
- Notes in the range are pinned to the chart and listed under it.
Panels#
Each panel shows the top 10 rows of one dimension and has tabs to switch between dimensions:
| Panel | Tabs |
|---|---|
| Sources | Channels · Referrers · URLs |
| Pages | Top · Entry · Exit · Hostnames |
| Locations | Countries · Languages |
| Technology | Devices · Browsers · OS · Screens · Interaction |
| Campaigns | Campaign · Source · Medium · Content · Term |
| Conversions | Goals · Events |
Screens groups visits by the width of the visitor's screen. Hover a size to see its widths, or open the (i) beside the column name for all five:
| Size | Screen width | Usually |
|---|---|---|
| Extra small | under 414 px | most phones |
| Small | 414 to 767 px | large phones |
| Medium | 768 to 1023 px | tablets |
| Large | 1024 to 1439 px | laptops, tablets turned sideways |
| Extra large | 1440 px and up | most desktop screens |
In every panel you can:
- click a row to filter the whole dashboard by it,
- open View all for the full drill-down table,
- on the Top pages tab, use the icon on a row to open its page detail.
More dimensions (ref, browser and OS versions) are available in the
drill-down table and through the breakdown API operation.
Location is country only. Regions and cities aren't collected.