Automatic traffic insights
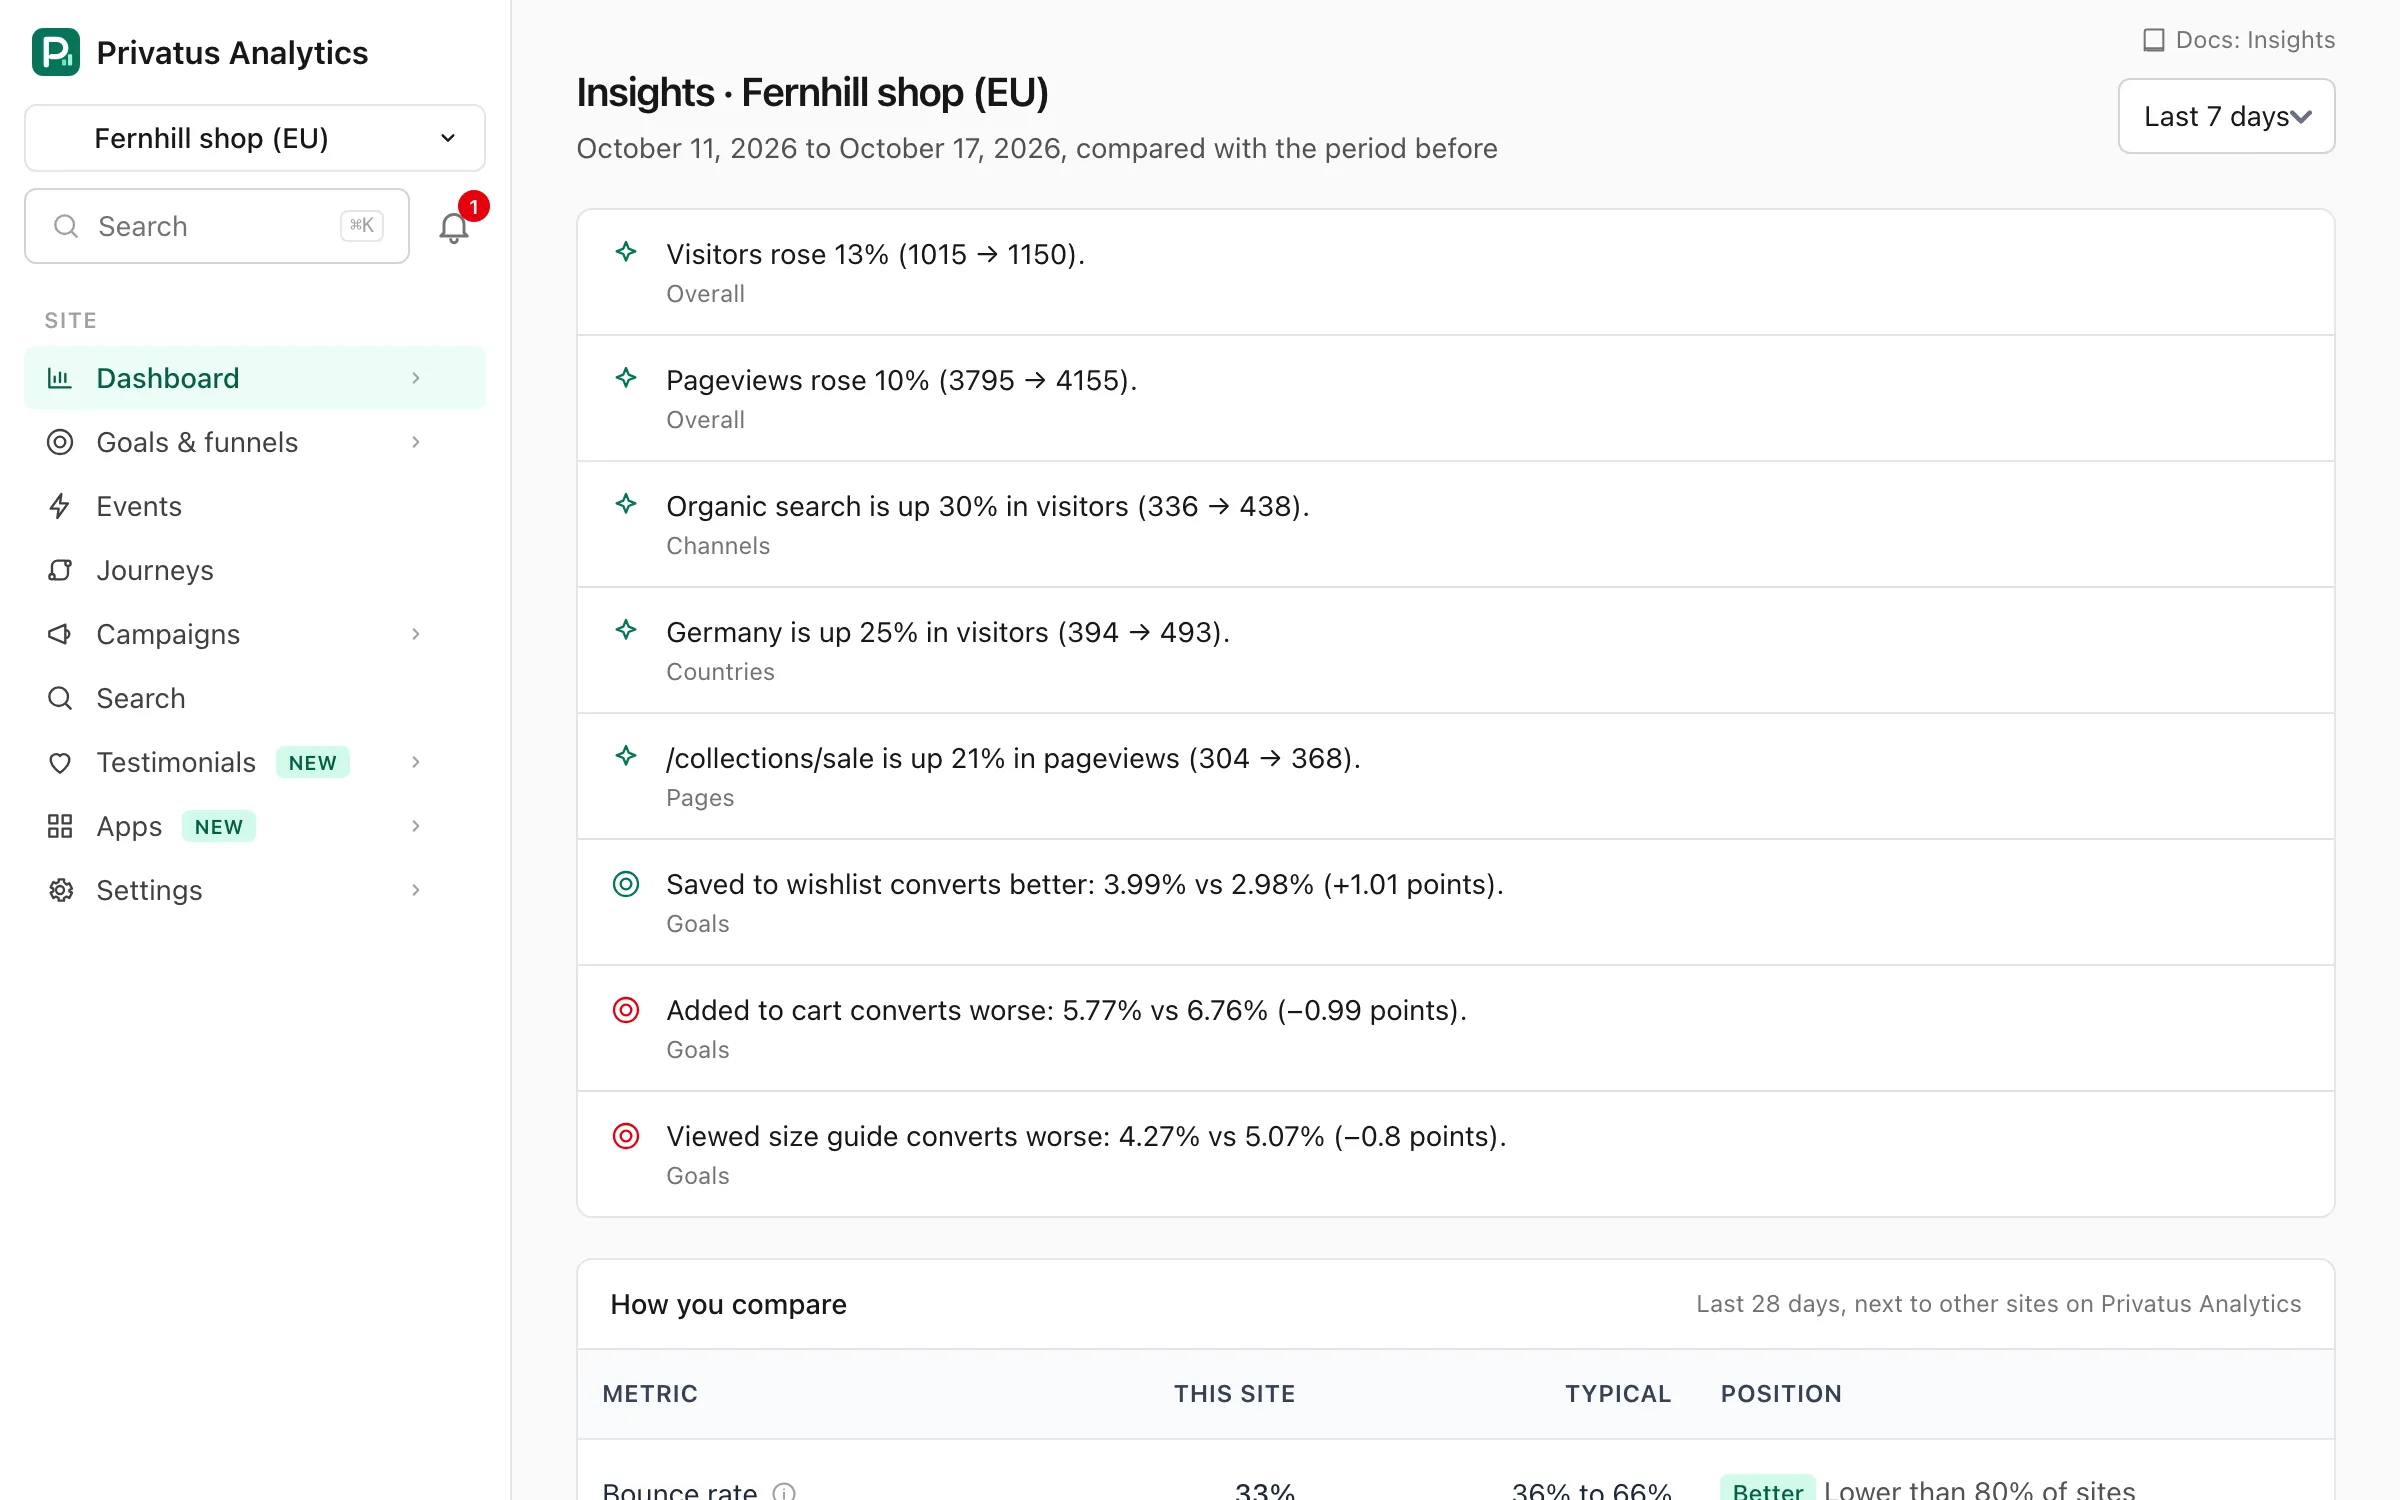
Insights lists the notable changes in your traffic, such as a channel sending more visitors or a page losing views, against the period before.
Insights compares the last complete days of a site with the same number of days before, and lists what changed most, each as one plain sentence with the numbers before and now. The top two are a card at the top of the dashboard. Open the rest from Insights under Dashboard in the menu, or from See all on the card.
Period#
| Option | What it compares |
|---|---|
| Last 7 days (the default) | The last 7 complete days with the 7 days before |
| Last 14, 28 or 30 days | The same, over 14, 28 or 30 days |
Today is never included, because it isn't complete.
What is listed#
| Insight | Shown when |
|---|---|
| Total visitors and total pageviews | Either period has at least 10. These come first |
| A channel, page or country that moved | Either period has at least 10 (visitors for channels and countries, pageviews for pages) and the change is 20% or more. The two biggest movers of each kind are kept |
| A channel, page or country that is new | It had nothing in the earlier period and at least 10 now |
| A goal whose conversion rate moved | The goal has at least 5 conversions in either period and the rate moved by 0.5 percentage points or more |
Up to 8 insights are shown, the largest changes first. Filters and segments don't apply to this page.
The same list is on the Ask page as Notable
changes this week, and in the API as GET /sites/<site id>/insights.json
(MCP: insights_get) with period (7d, 14d, 28d or 30d) and
limit (1 to 20).
How you compare#
Below the list, How you compare puts the site next to what is typical across all sites on Privatus Analytics, over the last 28 complete days (whatever period is chosen above).
| Column | What it shows |
|---|---|
| This site | The site's own number, the same one its dashboard shows |
| Typical | The middle half of all sites: a quarter of them are below the first number and a quarter above the second |
| Position | Better, Typical or Worse, and the share of sites the number is higher or lower than |
The numbers compared are the bounce rate, the bounce rate of visits that
start on the homepage (/), the visit duration, the pages per visit and
the five Web Vitals (p75). For bounce rates
and Web Vitals lower is better. For visit duration and pages per visit
higher is better.
A row appears once the site has enough data (50 visits, 50 visits that
start on the homepage, or 50 samples of a Web Vital in the 28 days) and
enough sites are behind the benchmark. Benchmarks are rebuilt every
Monday. In the API they are the benchmarks part of the same response.
What goes into a benchmark#
- One number per site, such as its bounce rate. Every site counts once, however busy it is.
- Only visits that were given a bot score and are not likely bots, so a benchmark describes people.
- At least 30 sites from at least 10 workspaces. With fewer there is no benchmark.
- Nothing that names a site or a workspace, and nothing about a visitor. Pages other than the homepage, sources, events and revenue are never part of one.
To leave your sites out, switch Benchmarks off in Workspace settings. Your sites are then not counted from the next Monday on, and the comparison is hidden for the workspace.
To be notified about a change as it happens, use alerts with an anomaly rule.