Homepage A/B test, a case study
Nine sign-ups to none
I tested my long, thorough homepage against a page a third its length, and every sign-up went to one of them.
 By James Andrews
6 minutes read
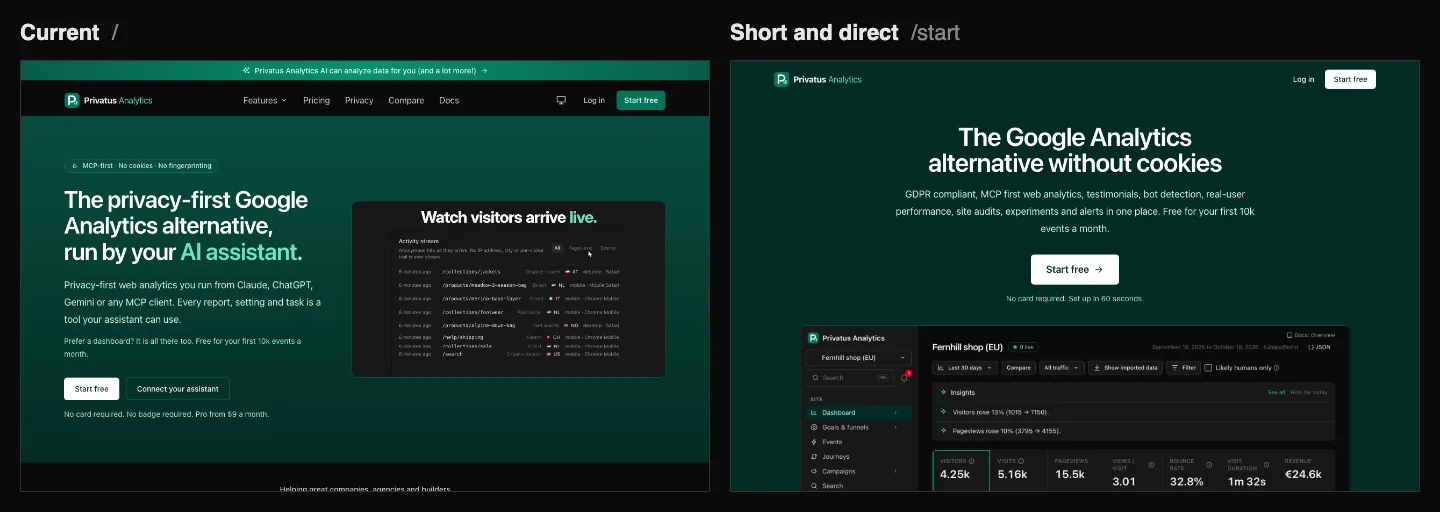
Since October 13th Privatus Analytics has had two homepages. The first,
at /, is the one I wrote first. It opens with a
bar announcing a feature, a menu of five sections and a headline about
running your analytics from an AI assistant, then explains the product
in a dozen sections. The second, at /start, is a third of the length.
It has one headline, one button and very little else. For nine days the
visitors who opened the homepage were shared between the two. One page
got nine sign-ups. The other got none. Here are their first screens.
Pick the one you would bet on.
The winner#
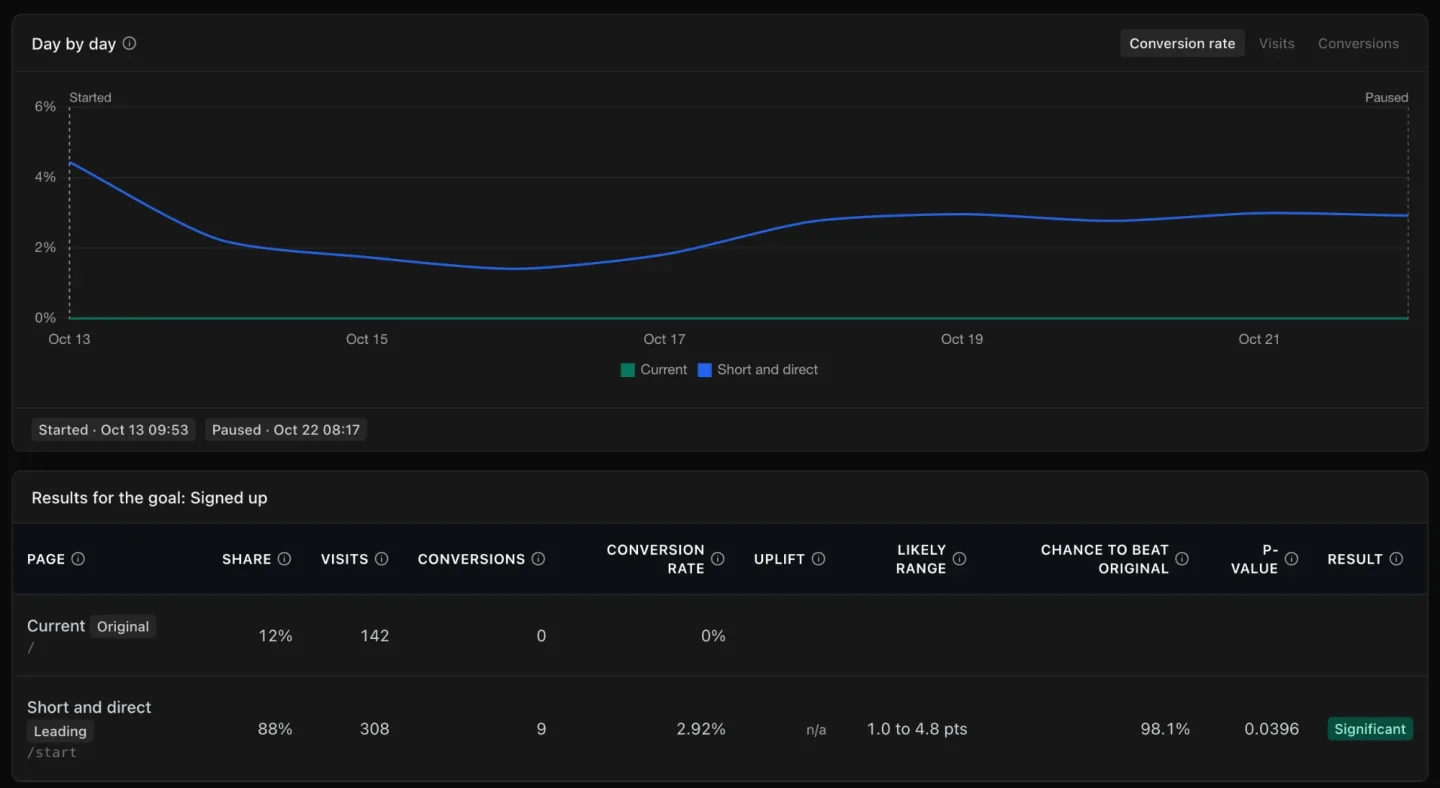
The long page, the one I wrote, got 142 visits and not one sign-up. The short page got 308 visits and nine. Its conversion rate was 2.92%, against nothing, and the statistics put the chance that it really is the better page at 98.1%.
| Page | Share at the end | Visits | Sign-ups | Conversion rate |
|---|---|---|---|---|
Current (/) |
12% | 142 | 0 | 0% |
Short and direct (/start) |
88% | 308 | 9 | 2.92% |
Why it won#
The current page opens with a bar that promotes a feature, a menu of five sections and the headline "The privacy-first Google Analytics alternative, run by your AI assistant." Running analytics from an AI assistant is the newest idea in the product, but it asks a stranger to care about something they did not come for. Most visitors arrive looking for an alternative to Google Analytics, and the short page says, in its first six words, that this is one, and that it uses no cookies. Then it shows the dashboard, and offers one button.
Choice itself has a cost. In 1952 W.E. Hick, a British psychologist, showed that the time people take to decide grows with the number of alternatives in front of them.1 The current homepage has 179 links, and five of them lead to sign-up. The short page has 15, and 11 of them do. Its header holds only the name, Log in and Start free, its footer only the terms and the privacy policy, and a bar with a Start free button appears at the top of the screen once the visitor scrolls.
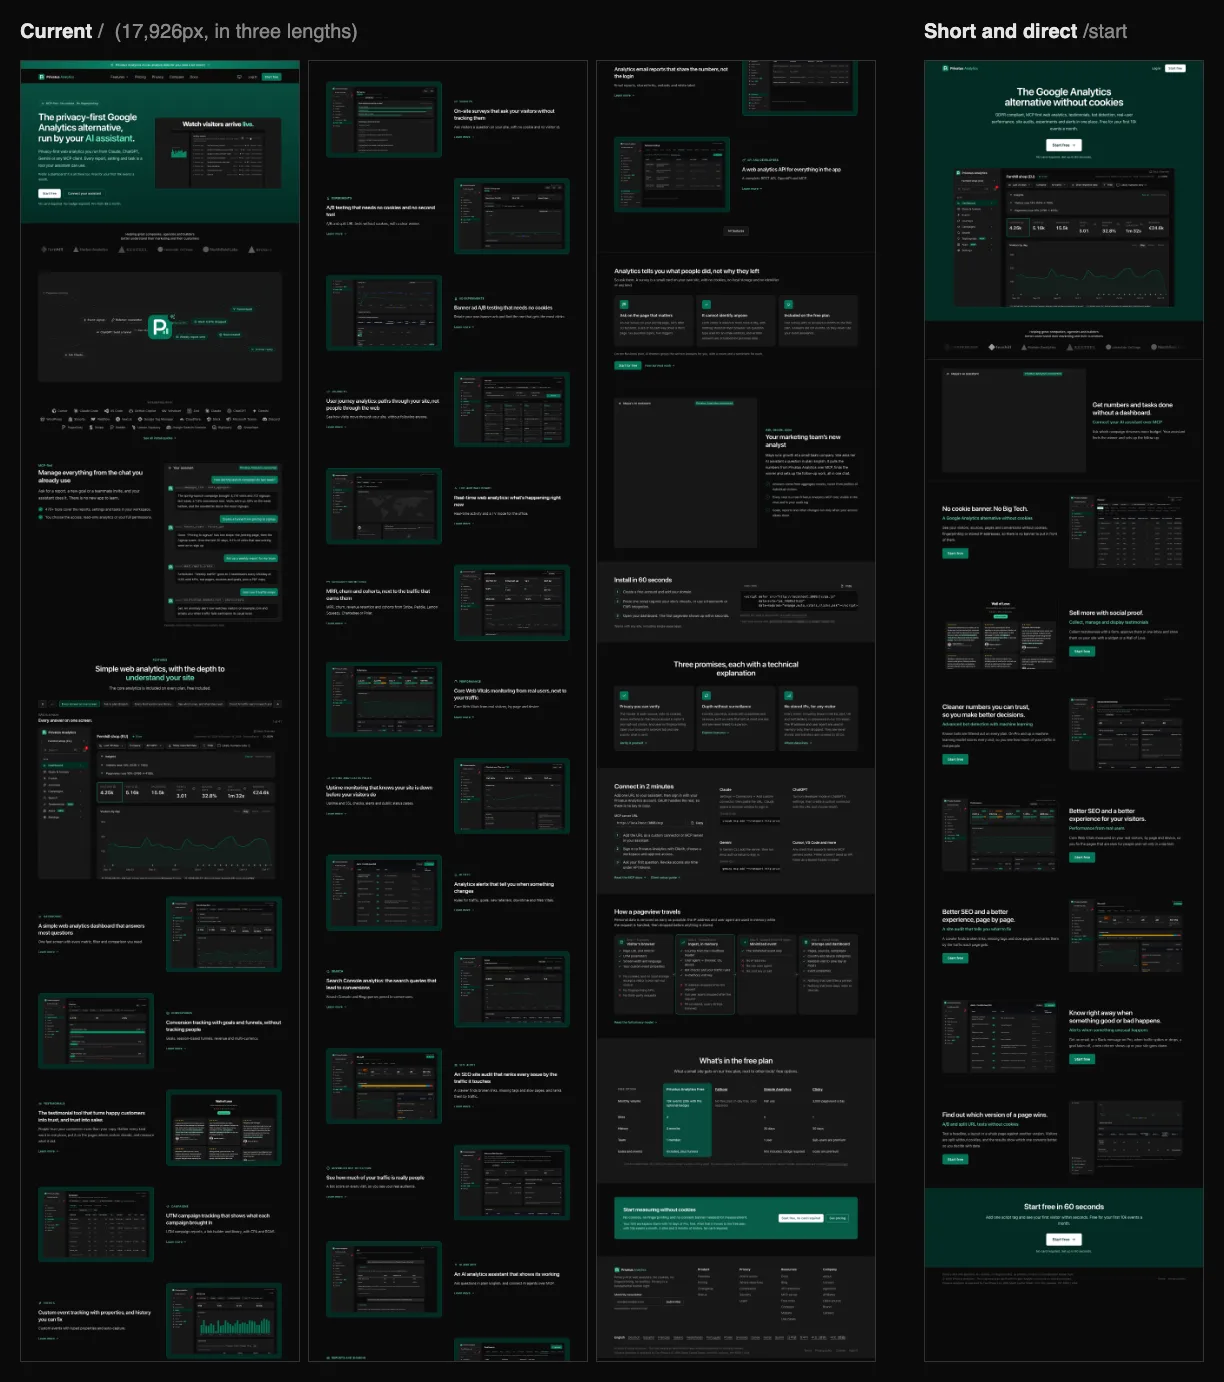
Length does the rest. At a laptop's width the current page is 17,926 pixels tall, the short one 5,657. Each section of the short page leads with what a visitor gets ("Cleaner numbers you can trust, so you make better decisions"), names the feature underneath and ends with the same Start free button. The long page explains much more, and I suspect that is the trouble. Someone who is still reading has not yet signed up.
A lead, not a verdict#
Nine sign-ups to none sounds decisive. The numbers are small, though, and I paused the test on the ninth day, before the 14-day minimum I had set, so the product had not yet called a winner. The true difference is likely between one and nearly five percentage points, which is a wide range.
There is a second caveat. Many homepage visits come from software, not people (an earlier post found that most of one site's traffic was bots). This test was no different. Advanced Bot Detection scored every visit, and more than half of each page's visits were likely bots.
| Page | Total visits | Likely bot | Likely human | Unsure or not scored |
|---|---|---|---|---|
Current (/) |
167 | 99 | 59 | 9 |
Short and direct (/start) |
310 | 160 | 108 | 42 |
These count every visit that viewed each page from October 13th to 22nd,
so they differ a little from the experiment's own counts (after the
pause, everyone was shown /). Counting only the visits in the
experiment that were scored as likely human, the short page still led,
eight sign-ups from 106 visits against none from 45, a conversion rate
of 7.55%. One of the nine sign-ups came from a visit not scored as
likely human. With so few people, the lead falls just short of
significance. The direction is clear. The size is not yet known.
How the test worked#
The test ran on Experiments, the A/B testing
part of Privatus Analytics. The original page stays at /. The variant
is a real page of its own, at /start. When a visitor opens the
homepage, the tracking code asks which version they get, and those given
the variant are sent on to it. Each version is then judged on a
goal, here "Signed up".
It needs no cookies and stores nothing in the visitor's browser. The version is worked out again on each visit from a secret that belongs to the experiment, together with the visitor's IP address and browser string. These are used in memory and never stored, so the same person on the same network gets the same page throughout. The docs set out exactly how visitors are shared out.
I also switched on "Steer to the leader". Once a day it moves the shares toward the page that is more likely to be winning, so fewer visitors see a loser while the test runs. Each page keeps at least 10%, so a page that started badly can still recover. By the end, the long page was getting 12% of visitors and the short one 88%, which is why their visit counts differ.
Machinery before marketing#
When I start a new website, SaaS or side project, I work on the machinery inside it before I spend much on bringing people to it. That means the homepage, the sign-up form and the first minutes in the product. Promotion multiplies whatever the site already does. If one visitor in 34 signs up, 1,000 visitors bought with ads, posts and cold emails bring in about 29 customers. If none do, those 1,000 visitors bring in nothing, and the time and money spent on them are gone. This test says my old homepage was closer to the second case than I had thought.
So the order matters. Fix the page that turns visitors into users, then promote it. Doing it the other way round does not just waste effort. It also tells you the wrong thing: that the channel failed, when the page was what failed.
Run your own#
None of this means short pages always win. It means my page did, with my visitors, this month. Yours may be different, and the only way to know is to test it. Build the second version as its own page, create an experiment on Experiments, pick a goal and press Start. The Free plan runs one experiment at a time with the original and one variant, and steering, targeting and more variants come with Pro (see pricing). If you are moving from Google Analytics, the tracking code that runs your reports also runs your tests. Start free, then test the page before you pay to fill it. The cheapest visitor is the one who already came.
References#
W.E. Hick, "On the Rate of Gain of Information", Quarterly Journal of Experimental Psychology, 4(1), 1952, pages 11 to 26. https://doi.org/10.1080/17470215208416600
About the author
James Andrews · Founder
Founder of Privatus Analytics. I have built and sold SaaS businesses since 2009, and I wrote this from what I measure on my own sites.
More from the blog
-
The million SaaS Browser visitors who never were
Google Analytics credited one of my websites with 1.2m users in a month. Most of them were software.