Uptime monitoring
Monitor uptime with HTTP, keyword, TCP and DNS checks from our US datacenter, plus SSL certificate and domain expiry, incident history and downtime alerts.
Checks#
Watch: Traffic alerts: know in minutes when signups drop (2:13)
Traffic alerts that tell you in minutes, not on Monday, when signups drop, a checkout breaks or your site goes down. One message, then an all clear.
Transcript
Your signups dropped to zero on Friday night. You found out on Monday. That's a whole weekend of sales, gone.
I'm James, founder of Privatus Analytics. Let me make sure that never happens to you.
Here's how a weekend like that happens. A deploy on Friday afternoon breaks the checkout button. Nothing crashes, nothing errors, the page just stops converting. Nobody watches a dashboard on a Saturday. So the first sign is a customer email on Monday, or worse, a quiet month-end. It isn't only breakages. A tracking script goes missing after a redesign and you lose two weeks of data. A post takes off and you find out after the moment has passed. You tried alerts before. They pinged you for every wobble, ten times a day, until you muted them. Then the real one came and you missed it. Or you bolted on a monitoring tool, with its own script on every page and its own bill, to watch a number your analytics already had. Every hour something goes unnoticed costs you money, and you've got no way to notice.
With Privatus Analytics, tell it what matters, and it keeps watch every five minutes. Traffic, signups, sales, a new site linking to you, or your site going down. Don't know what normal looks like? You don't have to. It compares today with the same time over the last four weeks and spots anything unusual, good or bad. You hear about it once, and again when things are back to normal. No flood of messages. It watches your site being up as well, and warns you before your certificate or your domain expires. No extra script, no extra tool. Alerts arrive by email, Slack, Teams, Discord, or a push to your browser. Or tell Claude or ChatGPT, over MCP: alert me if traffic drops. Done.
You hear about problems in minutes, not on Monday. A broken checkout gets fixed while there's still a weekend to save. And you only get the alerts that matter.
Set your first alert before the weekend. Start free at privatusanalytics.com.
Create checks with Add check on a site's Uptime page, or on the
workspace's Uptime page for checks that belong to no site. Managing
checks needs the uptime.manage permission.
A check runs only against the domain of a verified site of the workspace, or a subdomain of it. Until then it waits, and the page says so. We never probe someone else's server for you.
A site's Uptime page lists that site's own checks, plus any workspace
check whose target is the site's domain or a subdomain of it (and the
same for the site's extra domains). So a check you added on the workspace
page for app.example.com also shows on the example.com site, marked
Workspace check. Members and API tokens limited to some sites see
only the checks tied to their sites. The workspace's Uptime page
lists every check.
The same matching applies to a site's Uptime block in an email report and to an Uptime dashboard card. It does not apply to alerts: an uptime or SSL alert with no check chosen watches only the checks tied to its site.
| Type | Up when |
|---|---|
| HTTP status | The URL responds with the expected status code |
| Keyword | The URL responds with the expected status code and the response body contains the keyword |
| TCP port | The host accepts a connection on the port |
| DNS | The hostname resolves to at least one address |
| Field | Applies to | What it does |
|---|---|---|
| Name | All | Optional, up to 100 characters. Defaults to the hostname |
| URL | HTTP status, keyword | The address to request. On a site's Uptime page it defaults to https://<site domain>/ |
| Expected status | HTTP status, keyword | The status code that counts as up. Defaults to 200 |
| Keyword | Keyword | Text the response body must contain, up to 200 characters. Matching is case-sensitive and reads the first 2 MB of the body |
| Host | TCP port, DNS | The hostname to connect to or resolve |
| Port | TCP port | 1 to 65535 |
| Check every | All | 30 seconds, 1, 2, 5, 10, 15 or 30 minutes, or 1 hour, limited by your plan. Defaults to 5 minutes |
| Timeout (seconds) | All | 1 to 30. The whole request must finish in this time. Defaults to 20 |
| Can be shown on status pages | All | Lets the check be added to a status page. Off by default |
HTTP and keyword checks send a GET request and follow up to 3
redirects. A redirect is not followed when its status code is the
expected status. Over the API, http_method can be set to HEAD.
Private and internal addresses can't be checked.
Pause stops a check and Resume starts it again.
| Plan | Checks per workspace | Fastest interval |
|---|---|---|
| Free | 3 | 5 minutes |
| Pro | 20 | 1 minute |
| Business | 100 | 30 seconds |
Where checks run from#
Every check runs from our US datacenter (US East).
When is a check down?#
When a probe fails, the check is run again 30 seconds later. The check is down only if that second probe fails too. An incident opens when a check goes down and closes when it recovers.
Check detail#
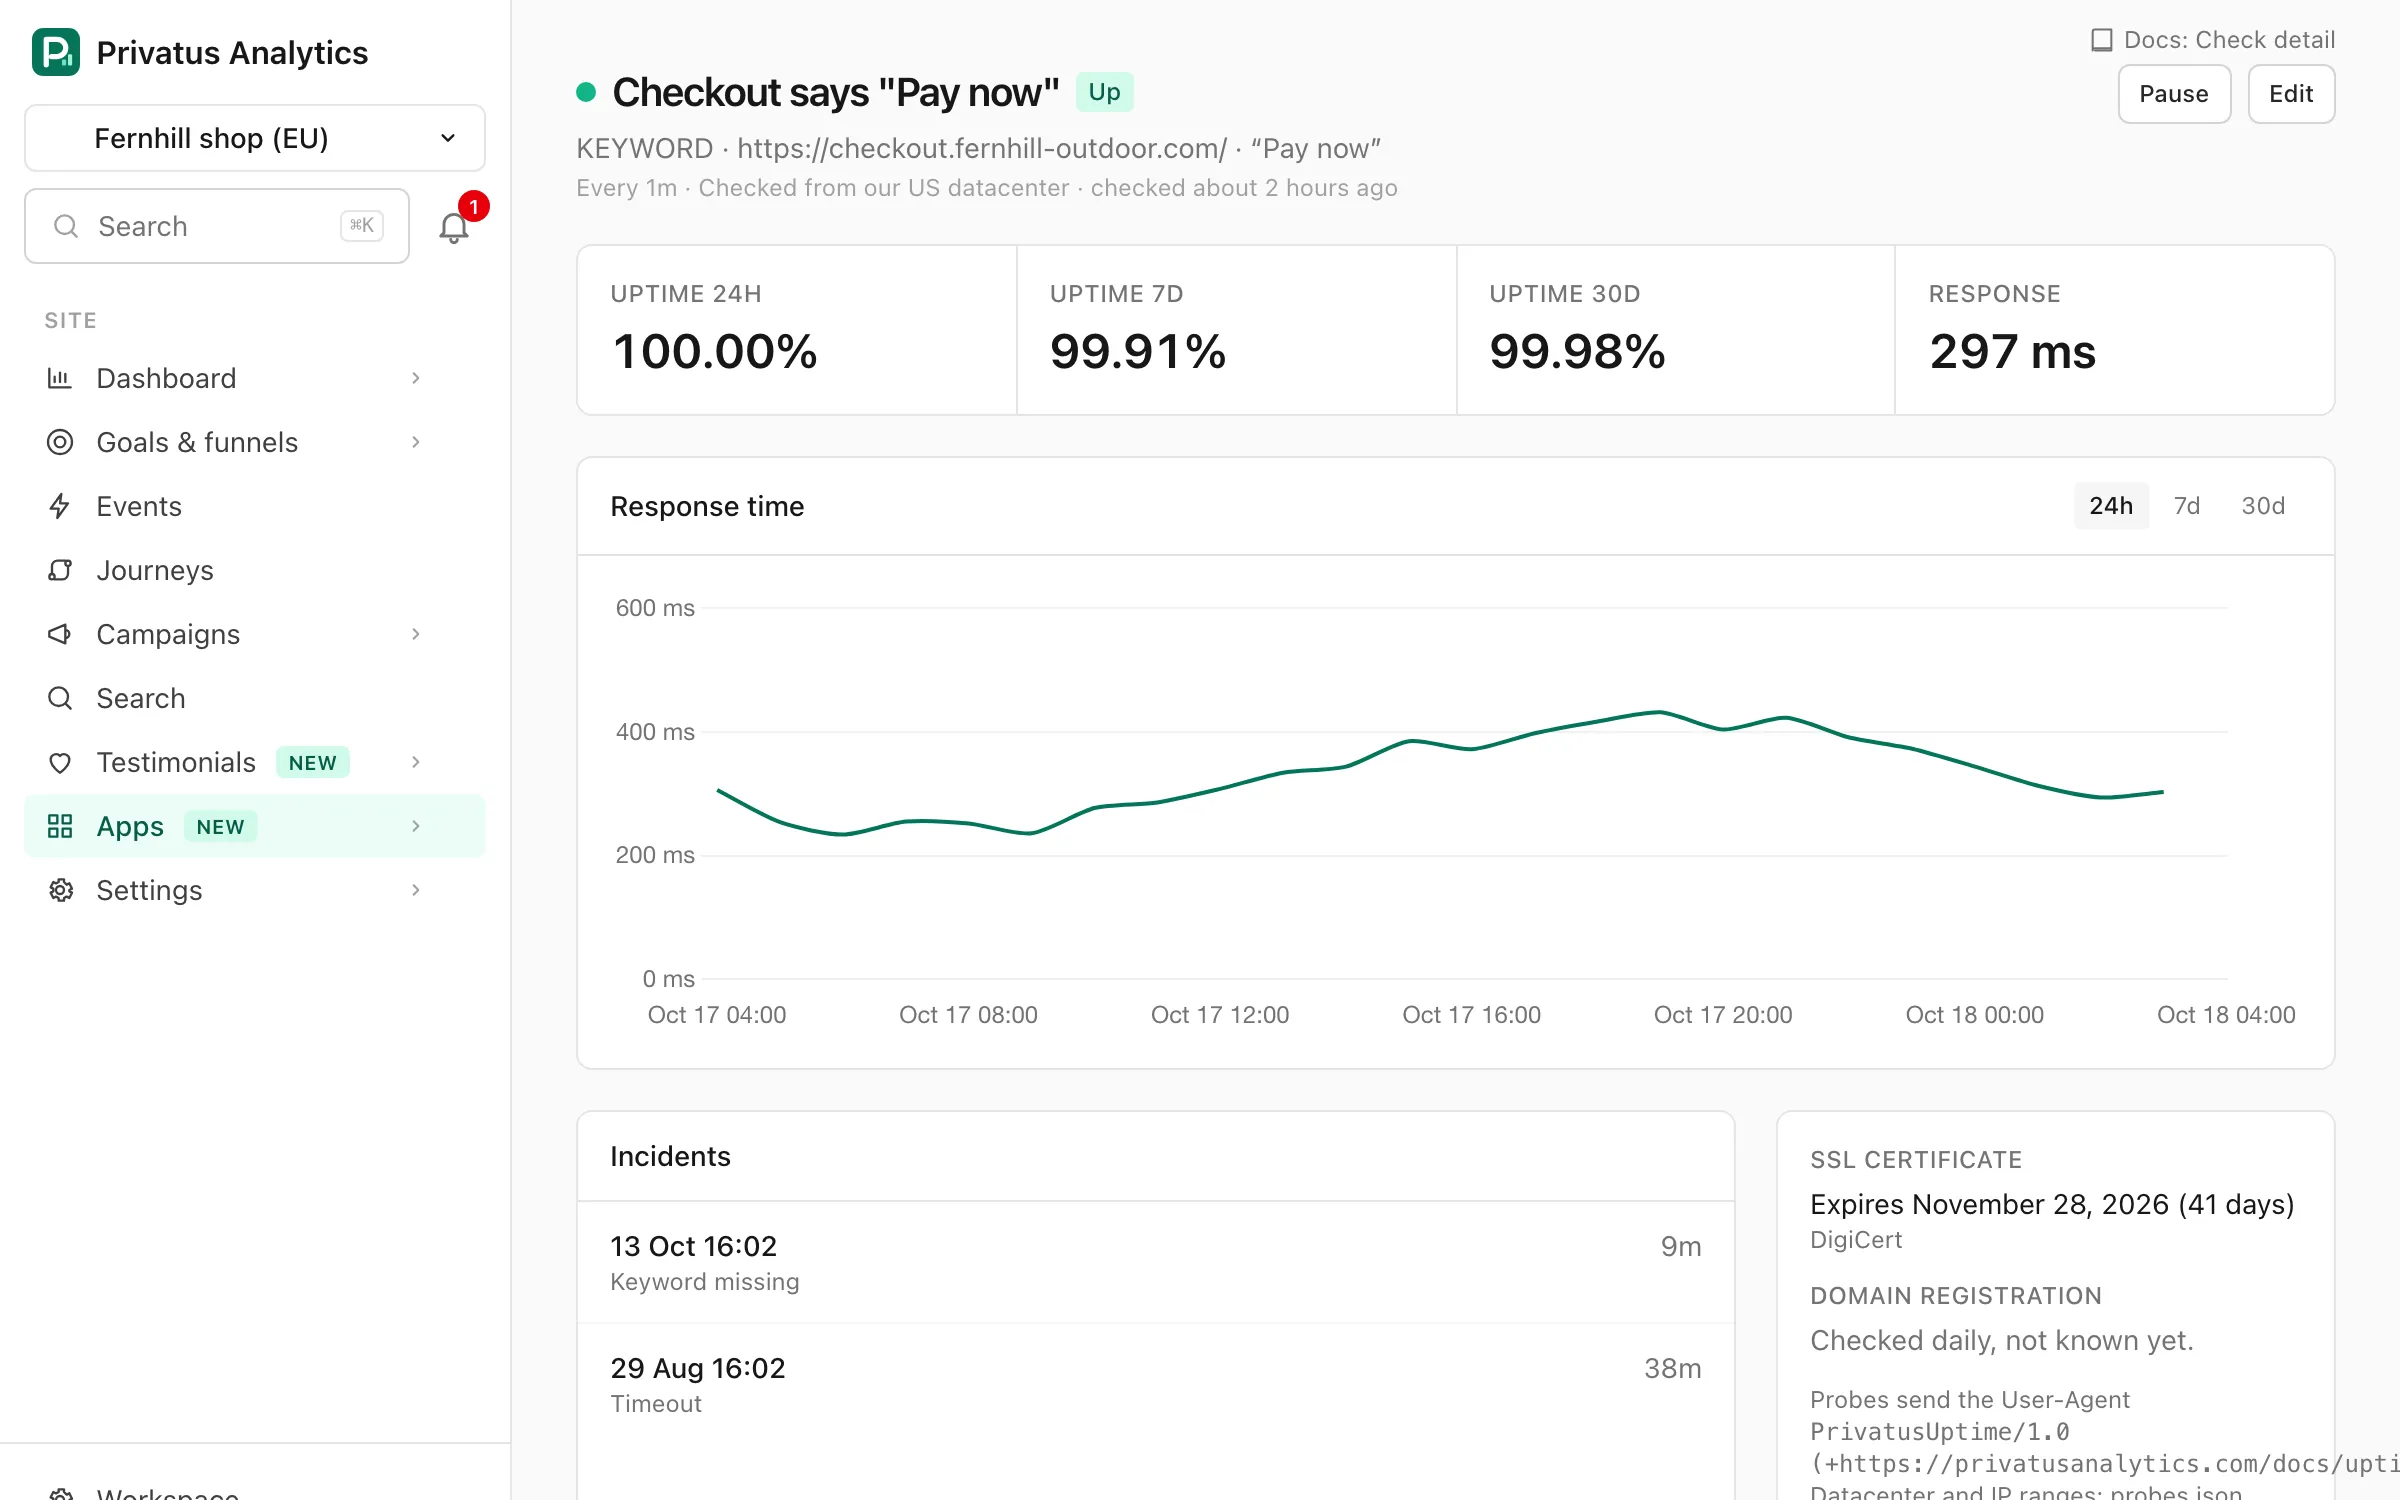
- Uptime for the last 24 hours, 7 days and 30 days, and the latest response time.
- A response time chart for 24 hours, 7 days or 30 days.
- The last 50 incidents: start, duration and the cause (timeout, connection refused, connection error, SSL error, DNS did not resolve, keyword missing, too many redirects or an unexpected status code).
- For HTTPS checks: the SSL certificate issuer and expiry date. For the check's domain: its registration expiry (from RDAP). Both are looked up once a day.
Uptime % is the share of the period not covered by an incident. Probe results are kept for 90 days.
Alerts#
When a check goes down or recovers:
- the workspace's owners and admins who can see the check's site get an email,
- the
uptime.downanduptime.upwebhook events fire, - subscribers of a published status page that shows the check get an email,
- and, when the check belongs to a site, the incident appears as a note on that site's charts.
The same owners and admins get an email 14, 7 and 1 days before an SSL certificate or a domain registration expires.
Every uptime email has an Unsubscribe link (and the one-click button of mail apps) that stops the emails about that one check for that one person. See Unsubscribe.
For other channels, create Uptime down and SSL or domain expiry alerts. Alerts are delivered by email on every plan, by Slack, Teams, Discord, webhook and browser push on Pro and Business, and by PagerDuty and Opsgenie on Business.
The mobile app needs none of that. Every member who is signed in to it and can open the check's site gets a push notification when the check goes down and when it is back up, on every plan, with no alert and no channel to set up.
Allowing our probes#
Probes identify themselves with this User-Agent:
PrivatusUptime/1.0 (+https://privatusanalytics.com/docs/uptime)
The probe location and User-Agent, and our probe IP ranges when we
publish them, are available as JSON at
/uptime/probes.json.
Uptime checks don't count toward event usage.
Status pages#
Show checks on a public status page.
API#
Checks are REST resources and the MCP tools uptime_checks_list,
uptime_checks_create, uptime_checks_get, uptime_checks_update,
uptime_checks_delete, uptime_checks_pause and uptime_checks_resume
(workspace_uptime_checks_list and workspace_uptime_checks_create for
the workspace). kind is http, keyword, tcp or dns, and
interval_seconds takes any value from your plan's minimum up to 86,400.
The API reference lists every input.