Core Web Vitals monitoring
Monitor real-user Core Web Vitals (LCP, INP, CLS, FCP and TTFB) at the 75th percentile by page, device, browser and country, with automatic regression notes.
The snippet from Site settings → Tracking loads the
vitals module. If you wrote the
tag yourself, check that data-modules includes vitals:
Watch: Core Web Vitals + SEO audit: fix what matters first (2:14)
Core Web Vitals from real visitors and an SEO audit ranked by real traffic, so you fix the slow checkout everyone uses before the broken page nobody visits.
Transcript
Your SEO tool found four hundred issues. Your speed test says your site is fine. Both are wrong about what to fix first.
I'm James, founder of Privatus Analytics. Let me show you the one list that's in the right order.
Here's a Tuesday you've probably had. You run a speed test. Green score. You run an audit. Four hundred issues, all marked urgent. You pick one and spend the day on it. The page you fixed gets twelve visits a month. Meanwhile your checkout is slow on the phones your customers actually use, and the audit never mentioned it, because the audit has never seen a single visitor. The speed test didn't catch it either. It ran once, on a fast computer, on a good connection. Your customers aren't on that computer. So the hours go in and the sales don't move. And Google is ranking you on the real-world speed your customers feel, not on the green score. The tools that do measure real users often do it by fingerprinting them or dropping a cookie, so you're back to a banner for a speed number.
Privatus Analytics measures speed from your real visitors, with the script already on your site, and without identifying any of them. You get the three numbers Google looks at, measured on real visits, marked good, needs work or poor. Then it ranks your pages by how much slowness they cause, weighted by how many people visit them. The slow checkout everyone uses goes to the top. The slow page nobody visits goes to the bottom. The audit works the same way. It checks your whole site like a search engine would, gives you one score out of a hundred, and because it knows your traffic, the issues on your busiest pages come first. That's the part other audits can't do. They've never seen your visitors. After every audit you see what's new and what's fixed, so you know if your last change helped or hurt.
No more drowning in a list of four hundred. You fix the page that's costing you the most, first. And your site gets faster for the people who actually buy.
Find out what to fix first. Start free at privatusanalytics.com.
<script defer src="https://privatusstats.com/js/pa.js" data-site="pa_YOURSITEID" data-modules="engage,auto,vitals,clicks,ask"></script>
Then open Performance from the site's Apps page.
Scorecard#
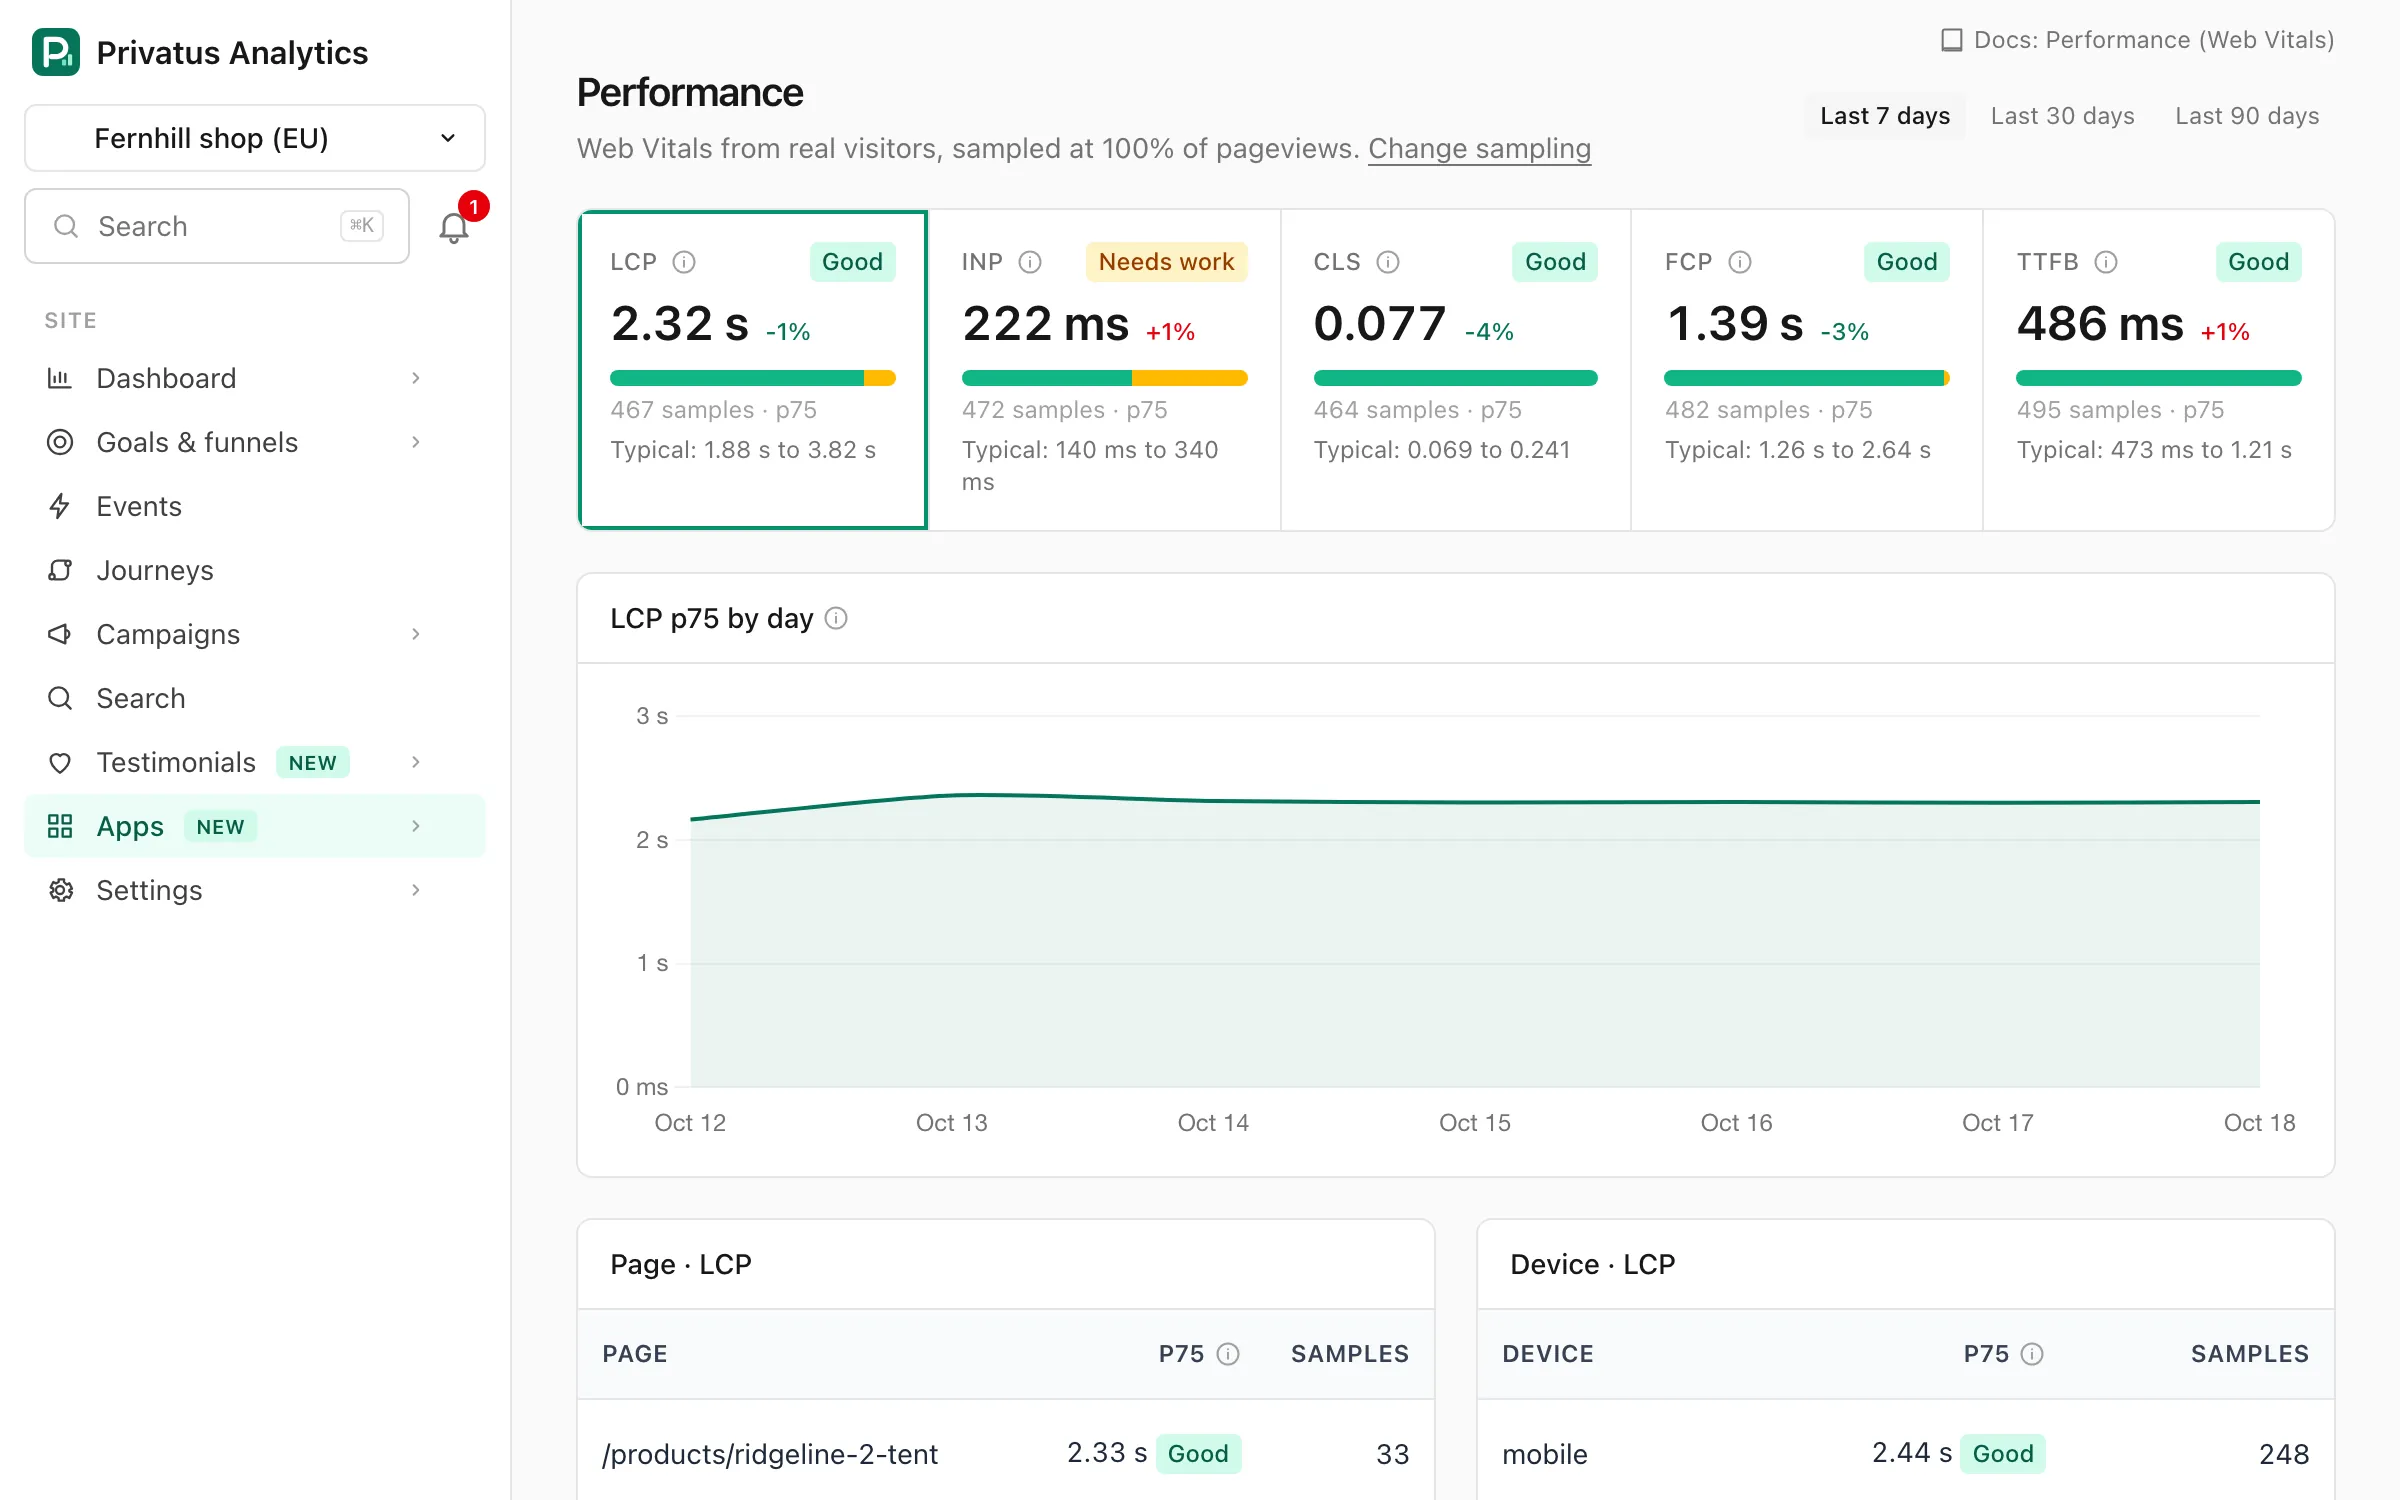
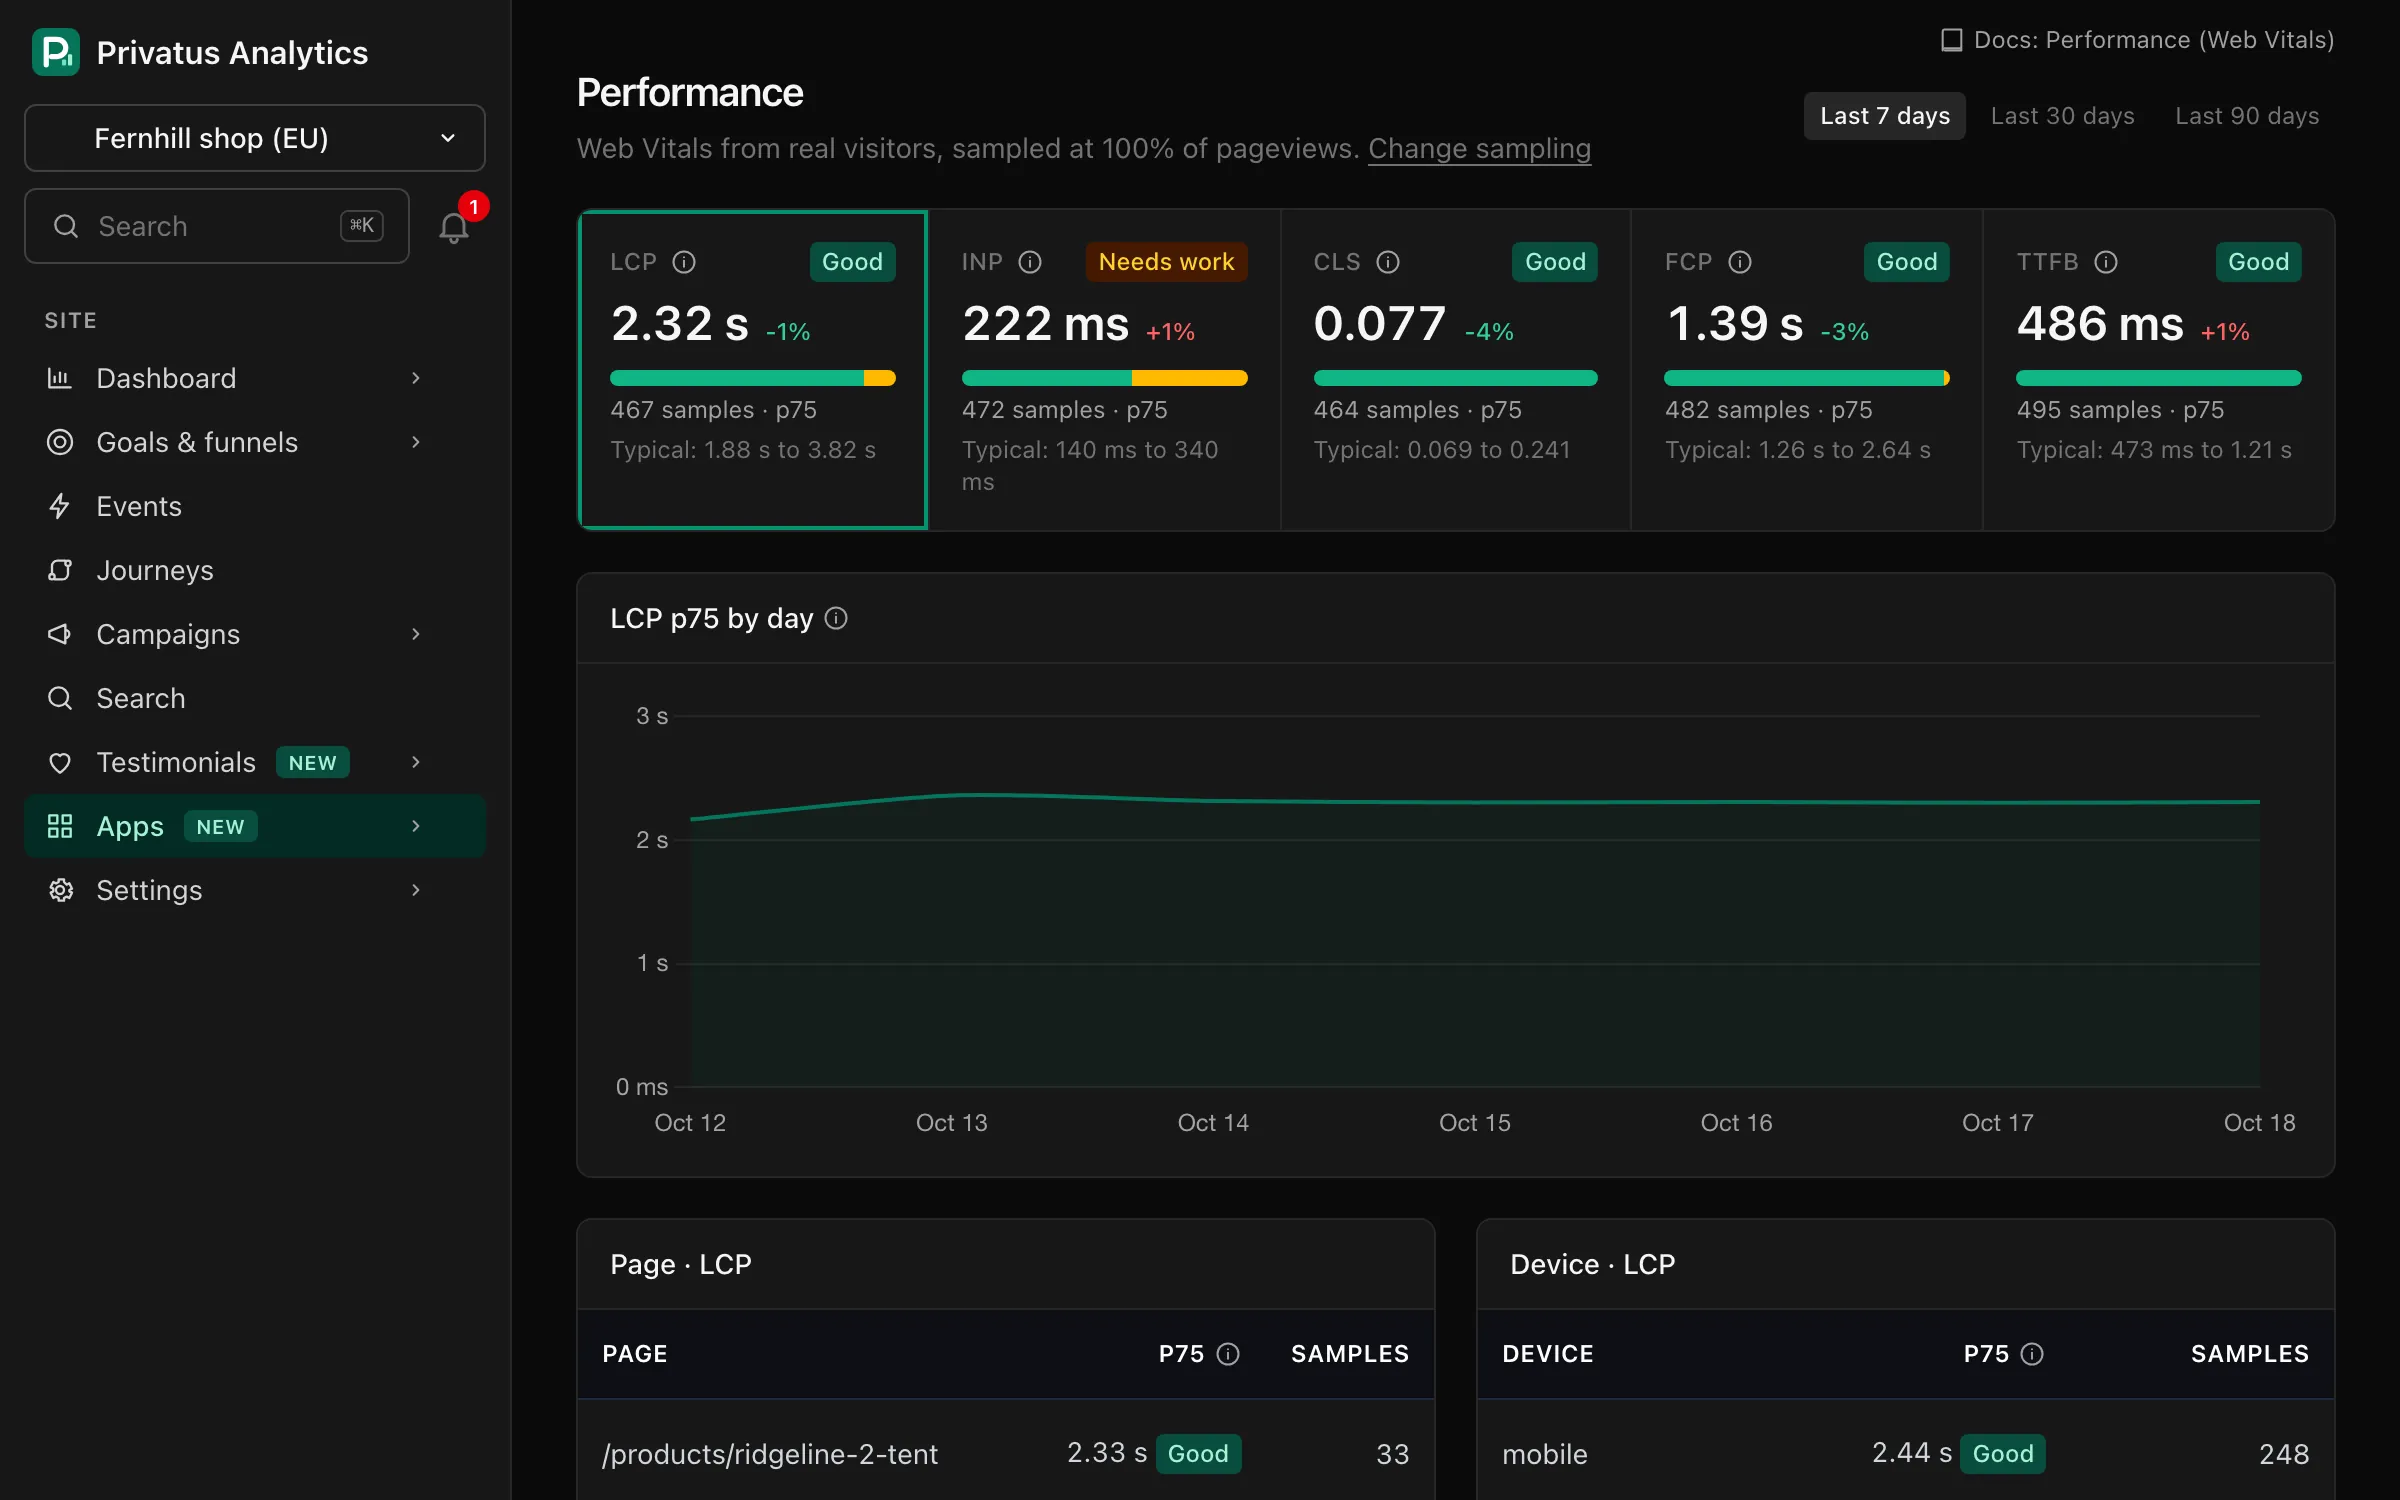
For each metric, the 75th percentile (p75) over the range, its rating, the number of samples, the share of samples rated good, needs work and poor, and the change in p75 against the previous period:
| Metric | Good | Poor |
|---|---|---|
| LCP (Largest Contentful Paint) | ≤ 2.5 s | > 4 s |
| INP (Interaction to Next Paint) | ≤ 200 ms | > 500 ms |
| CLS (Cumulative Layout Shift) | ≤ 0.1 | > 0.25 |
| FCP (First Contentful Paint) | ≤ 1.8 s | > 3 s |
| TTFB (Time to First Byte) | ≤ 0.8 s | > 1.8 s |
Under a metric, Typical is the middle half of the p75 values of all sites on Privatus Analytics over 28 days, once enough sites are behind it. See How you compare for what goes into it and how to switch it off.
These are Google's thresholds. Between good and poor is "needs work". The (i) next to each metric on the page says what it measures, why it matters, what a good value is and how to improve it.
Trend and breakdowns#
Select a metric (LCP at first) to see its p75 by day and its breakdowns by page, device, browser and country. Each breakdown lists ten rows, ordered by the number of samples slower than "good", so busy slow pages come before rare ones. The page detail view shows Vitals for one page by device.
Regressions#
Every day, each metric's p75 for the last 7 complete days is compared with the 7 days before. A rise of more than 20% (with at least 20 samples in each week) adds an automatic note to your charts, at most once a week per metric. To be notified, create a Web Vitals regression alert, which fires when a metric's p75 passes a limit you set.
Sampling and usage#
Vitals are sampled on the server at the site's sample rate (Site settings → Tracking). The Free plan allows up to 10% and paid plans up to 100%. The current rate is shown on the report. Web Vitals never count toward your event usage.
Over the API and MCP, performance_report
(GET /sites/<site id>/performance) takes metric (LCP, INP, CLS,
FCP or TTFB) and limit (rows per breakdown, up to 100).